Free Access
Fig. 5.
Download original image
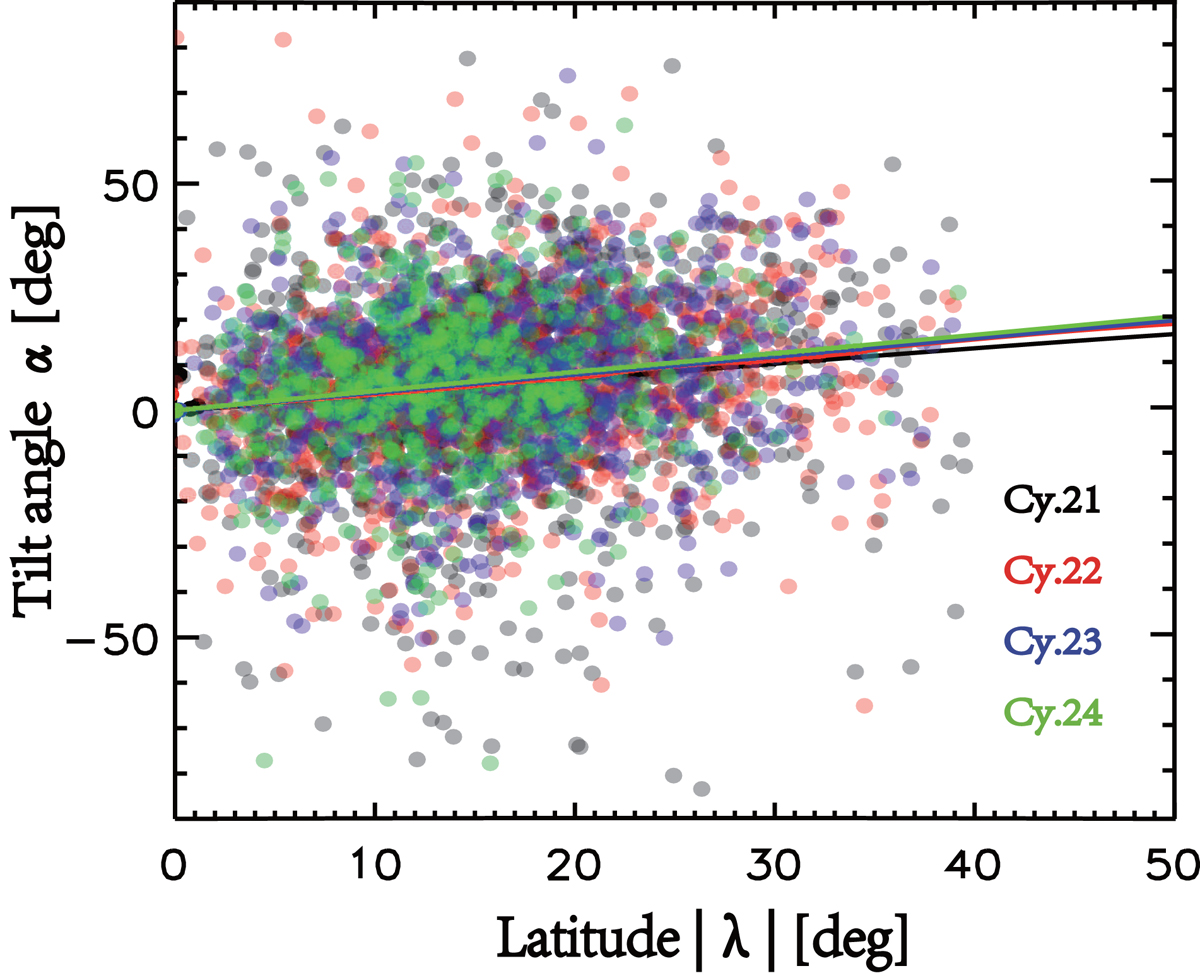
Joy’s law obtained by the unbinned fitting method based on the DPDmax with ![]() . Cycles 21 to 24 are shown in black, red, blue, and green, respectively. The solid lines show the linear fitting result of the thick points by the least square method.
. Cycles 21 to 24 are shown in black, red, blue, and green, respectively. The solid lines show the linear fitting result of the thick points by the least square method.
Current usage metrics show cumulative count of Article Views (full-text article views including HTML views, PDF and ePub downloads, according to the available data) and Abstracts Views on Vision4Press platform.
Data correspond to usage on the plateform after 2015. The current usage metrics is available 48-96 hours after online publication and is updated daily on week days.
Initial download of the metrics may take a while.