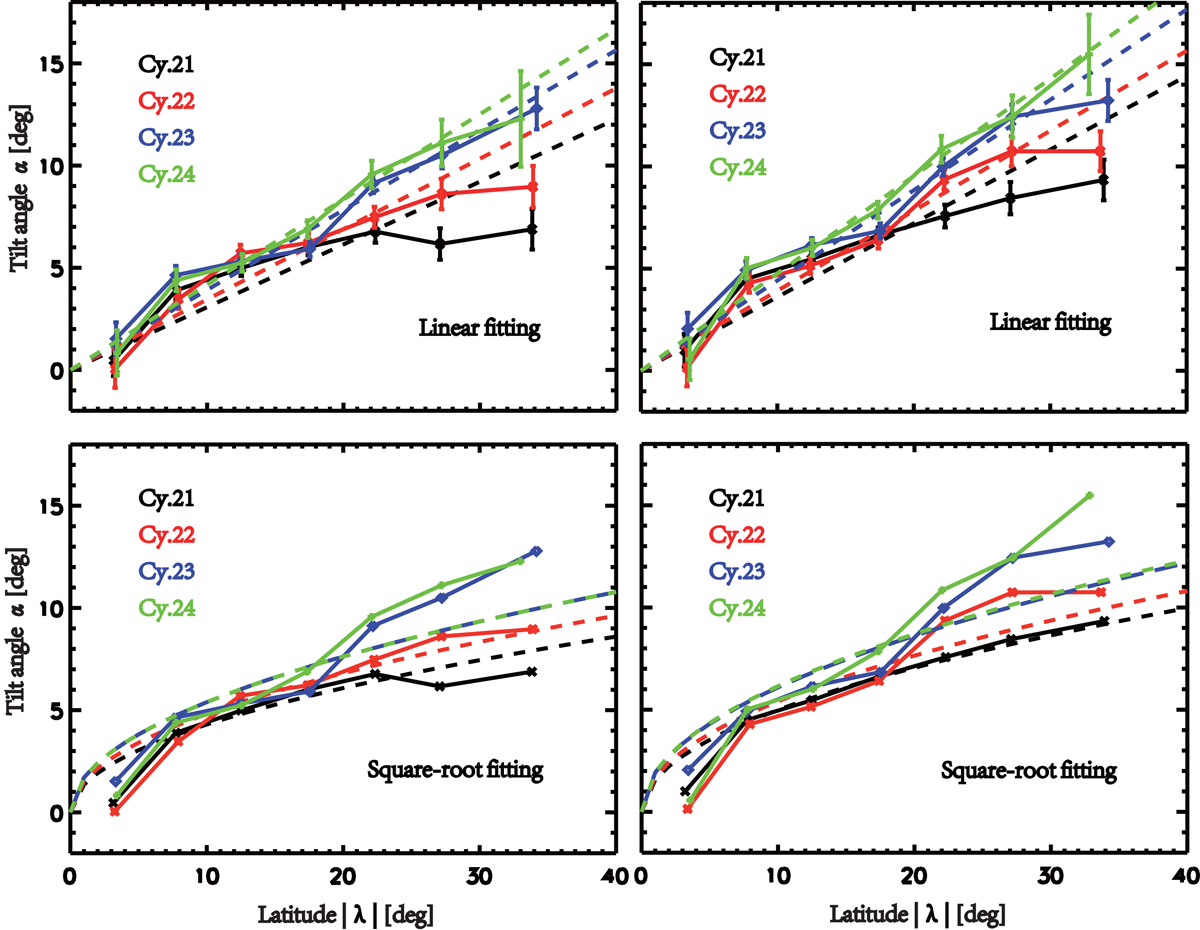
Fig. 4.
Download original image
Joy’s law obtained by the binned fitting method. The upper panels show the linear fitting and the lower panels show the square-root fitting. The left column is based on DPDall with Δs ≥ 0° and the right column is based on DPDmax with Δs ≥ 0°. Cycles 21 to 24 are shown in black, red, blue, and green, respectively. The dashed lines show the fitting result of the average values in 5° latitude bins by the least square method (the last bin contains data with latitudes greater than 30°). The error of the mean is the standard deviation of the bin sample divided by ![]() in each bin.
in each bin.
Current usage metrics show cumulative count of Article Views (full-text article views including HTML views, PDF and ePub downloads, according to the available data) and Abstracts Views on Vision4Press platform.
Data correspond to usage on the plateform after 2015. The current usage metrics is available 48-96 hours after online publication and is updated daily on week days.
Initial download of the metrics may take a while.