Free Access
Fig. 2.
Download original image
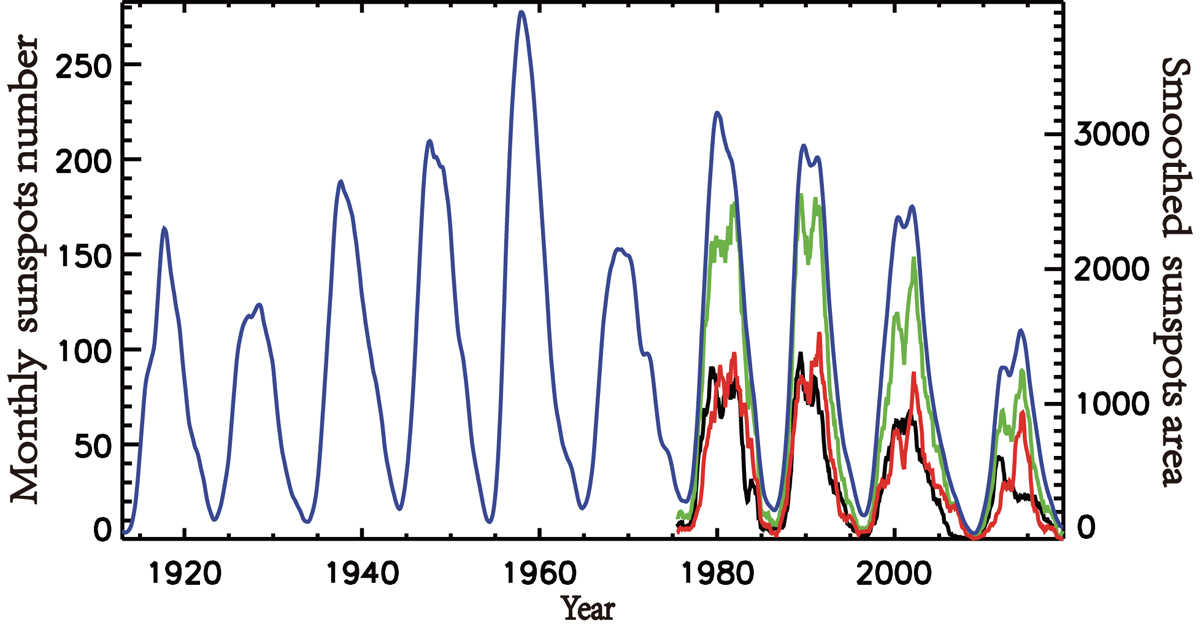
Two kinds of solar cycle strength data. The blue curve shows the 13-month smoothed monthly sunspot number during cycles 15 to 24. The black (red) curve is the 13-month smoothed monthly averages of the daily sunspot areas in the northern (southern) hemisphere. And the total sunspot areas are represented by the green curve.
Current usage metrics show cumulative count of Article Views (full-text article views including HTML views, PDF and ePub downloads, according to the available data) and Abstracts Views on Vision4Press platform.
Data correspond to usage on the plateform after 2015. The current usage metrics is available 48-96 hours after online publication and is updated daily on week days.
Initial download of the metrics may take a while.