Fig. 9.
Download original image
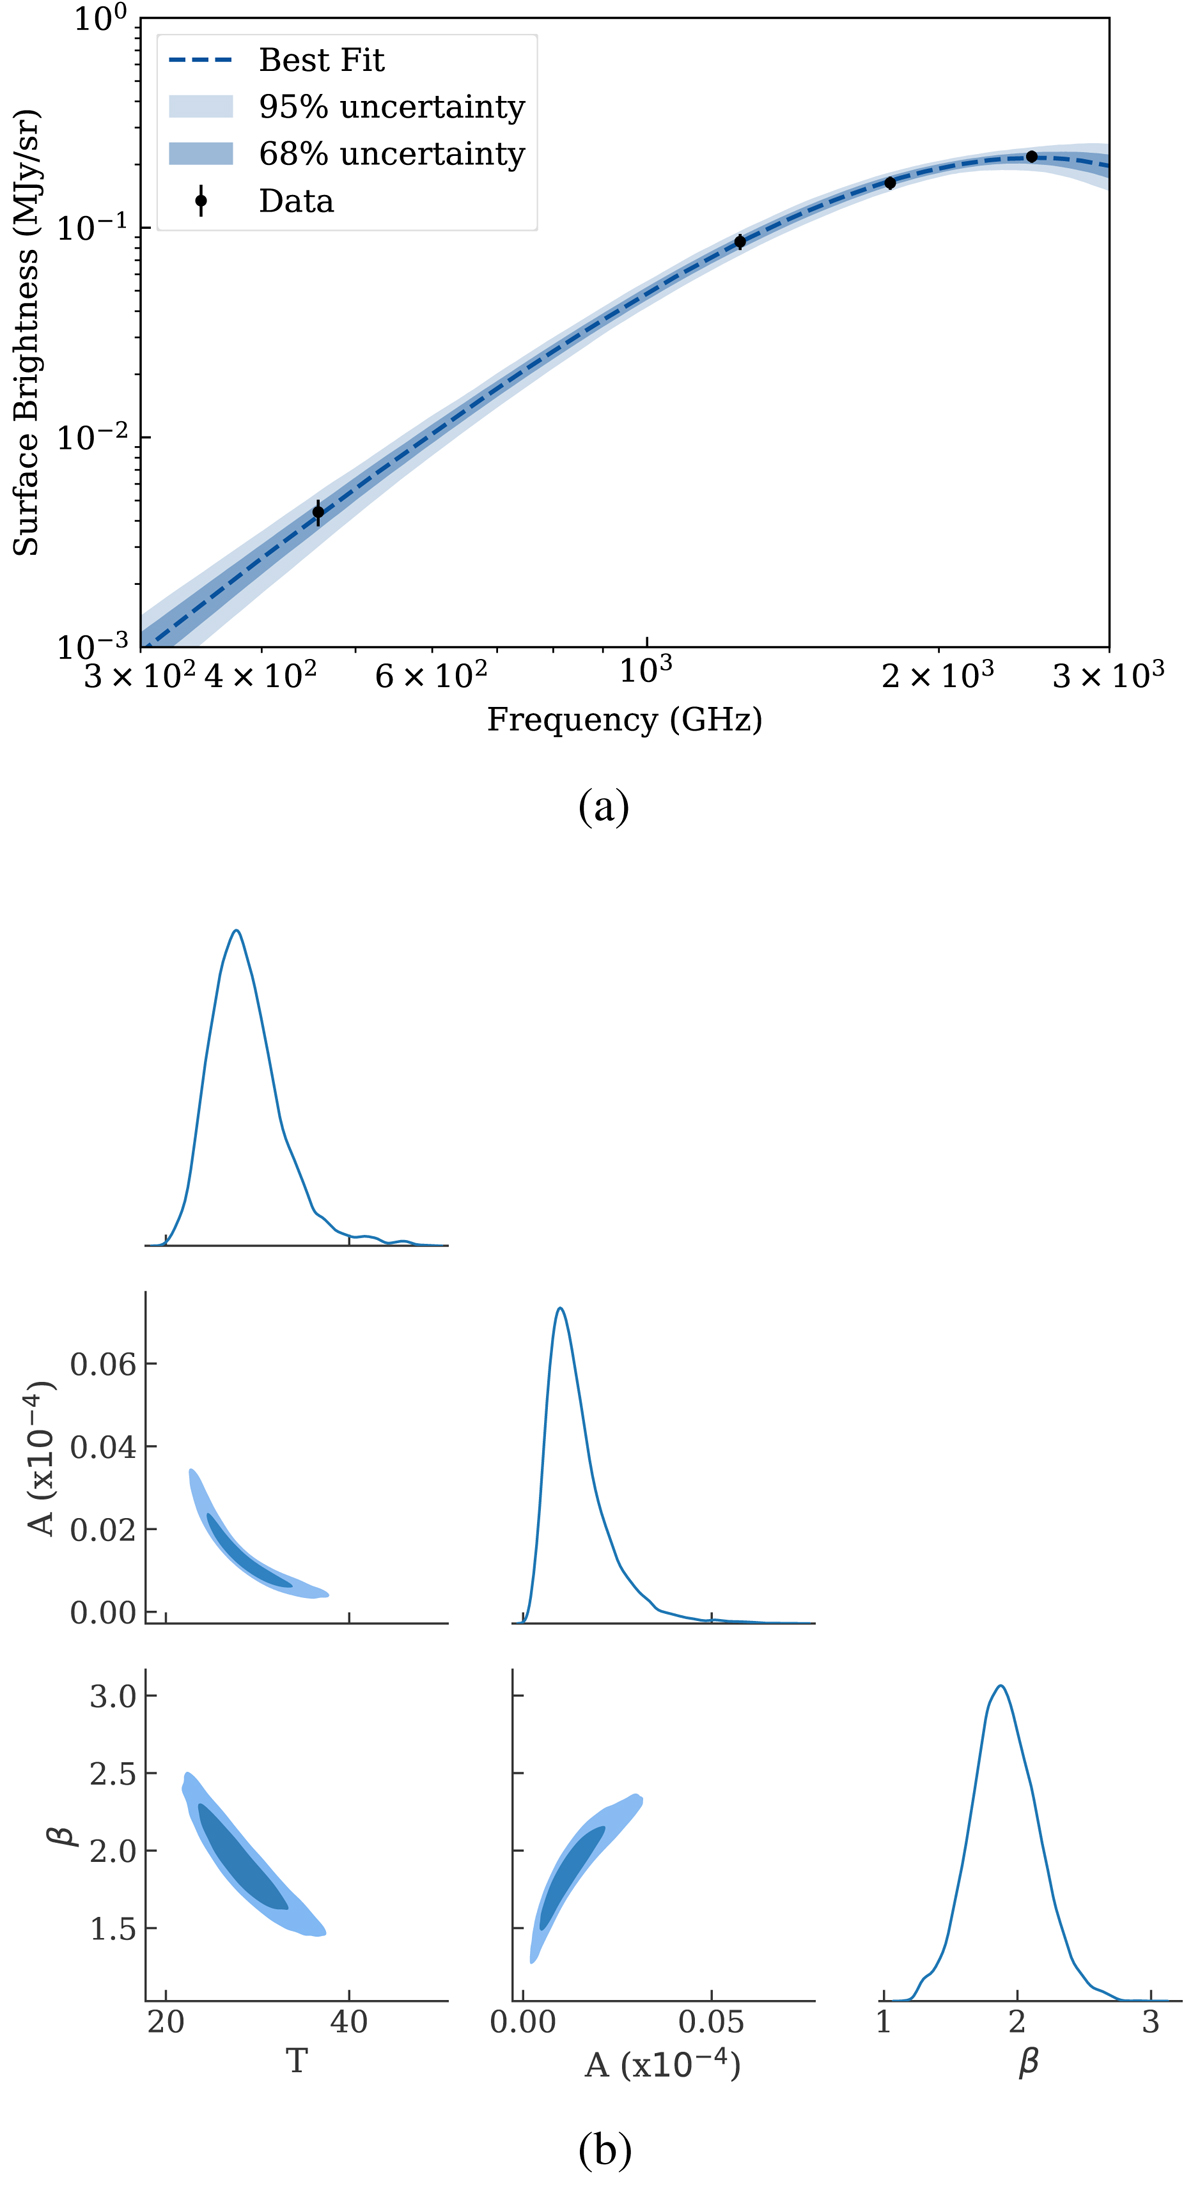
Gray-body fit constraints. (a) Maximum likelihood best fit of the form Eq. (6) to the mean emission from stacks on the MaDCoWS clusters at 224 (ACT), 600, 857, and 1200 GHz (Herschel). The total number of clusters in the stack is the 66 clusters in the H-ATLAS footprint for the three Herschel bands and 1572 for the ACT 224 GHz band. The dashed blue line is the best fit, and the light and dark blue bands represent the 68 and 95% confidence limit, respectively. The y axis is the surface brightness averaged over a 1.2′ radius aperture at the center of the stack. Error bars were estimated via bootstrapping. (b) Constraints on the dust temperature, ![]() K, the dust spectral index,
K, the dust spectral index, ![]() , and the normalization constant,
, and the normalization constant, ![]() . The light and dark blue contours show the 68 and 95% confidence intervals, respectively, for the 2D projections of the posterior probability. The 1D posterior probabilities are shown on the diagonal.
. The light and dark blue contours show the 68 and 95% confidence intervals, respectively, for the 2D projections of the posterior probability. The 1D posterior probabilities are shown on the diagonal.
Current usage metrics show cumulative count of Article Views (full-text article views including HTML views, PDF and ePub downloads, according to the available data) and Abstracts Views on Vision4Press platform.
Data correspond to usage on the plateform after 2015. The current usage metrics is available 48-96 hours after online publication and is updated daily on week days.
Initial download of the metrics may take a while.