Fig. 8.
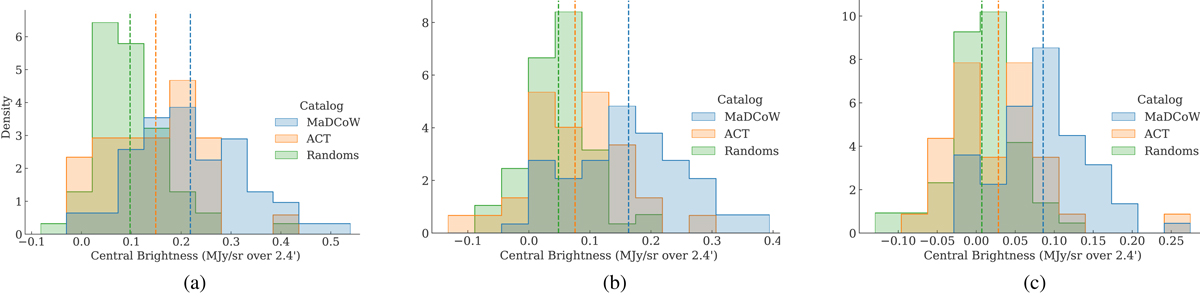
Download original image
Histograms of average surface brightness in Herschel submillimeter observations corresponding to a 1.2′ radius aperture flux, centered on ACT, MaDCoWS, and random cluster locations. The dashed lines show the average brightness for a given frequency and catalog. At 250 μm, the average surface brightness is 0.10 ± 0.08, 0.15 ± 0.10, and 0.22 ± 0.11 MJy sr−1 for the random, ACT, and MaDCoWS samples, respectively. At 350 μm, those surface brightnesses are respectively 0.05 ± 0.05, 0.08 ± 0.08, and 0.16 ± 0.09 MJy sr−1 for the random, ACT, and MaDCoWS samples. Finally, at 500 μm they are 0.01 ± 0.04, 0.03 ± 0.07, and 0.09 ± 0.06 MJy sr−1 for the random, ACT, and MaDCoWS. The statistically higher MaDCoWS emission at each Herschel frequency, along with the higher emission in the ACT 224 GHz channel (Fig. 7), indicates that the MaDCoWS clusters may be contaminated by dusty sources.
Current usage metrics show cumulative count of Article Views (full-text article views including HTML views, PDF and ePub downloads, according to the available data) and Abstracts Views on Vision4Press platform.
Data correspond to usage on the plateform after 2015. The current usage metrics is available 48-96 hours after online publication and is updated daily on week days.
Initial download of the metrics may take a while.