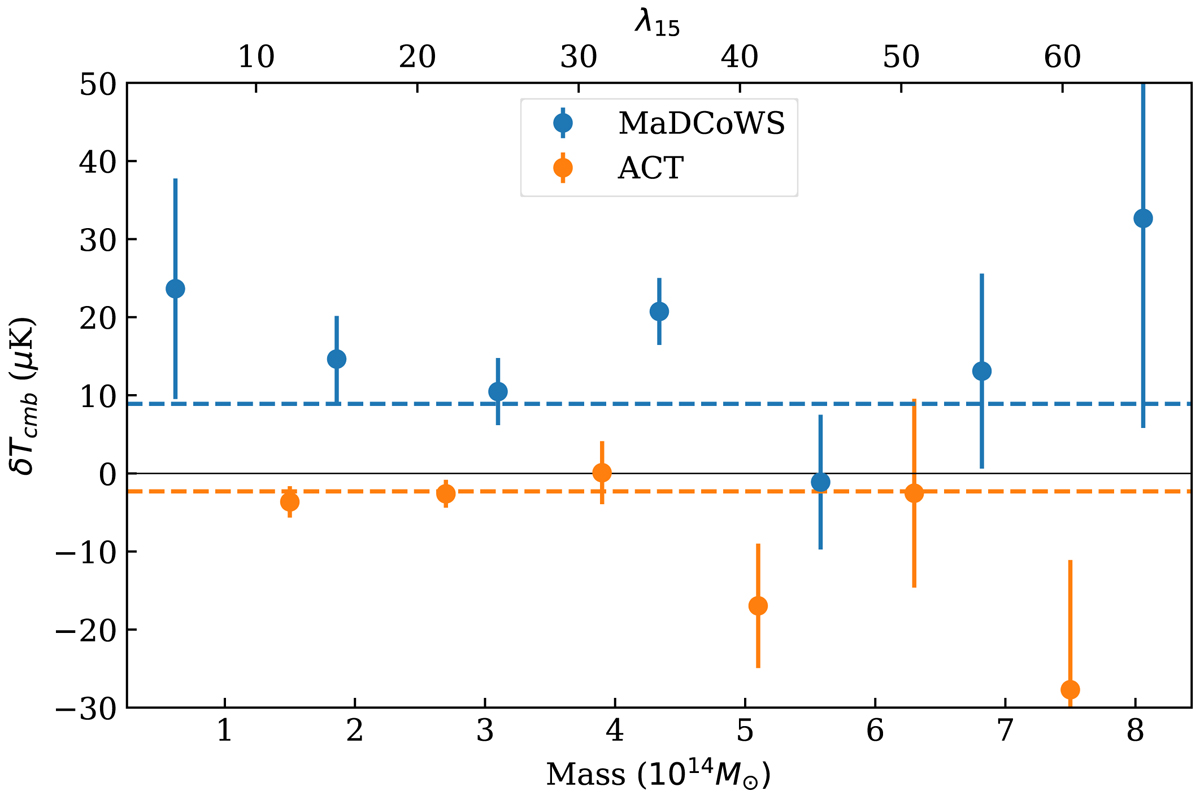
Fig. 7.
Download original image
Average 224 GHz emission for MaDCoWS (blue) and ACT (orange) clusters. MaDCoWS clusters were binned in richness, while the ACT clusters were binned in mass. Richness is plotted on the lower x axis while mass is plotted on the upper; the two scales are not equivalent, and are simply co-plotted for convenience. Error bars were estimated via bootstrapping. The MaDCoWS clusters show a statistically significant excess emission at 224 GHz on the whole, while the ACT clusters show a small decrement. In neither the ACT nor the MaDCoWS clusters is there a trend with mass or richness. The dashed lines indicate the average 224 GHz emission across all MaDCoWS (blue) and ACT (orange) clusters. We attribute the signal from the MaDCoWS cluster candidates at 224 GHz to IR emission and follow up with Herschel data (Sect. 5.2).
Current usage metrics show cumulative count of Article Views (full-text article views including HTML views, PDF and ePub downloads, according to the available data) and Abstracts Views on Vision4Press platform.
Data correspond to usage on the plateform after 2015. The current usage metrics is available 48-96 hours after online publication and is updated daily on week days.
Initial download of the metrics may take a while.