Fig. 6.
Download original image
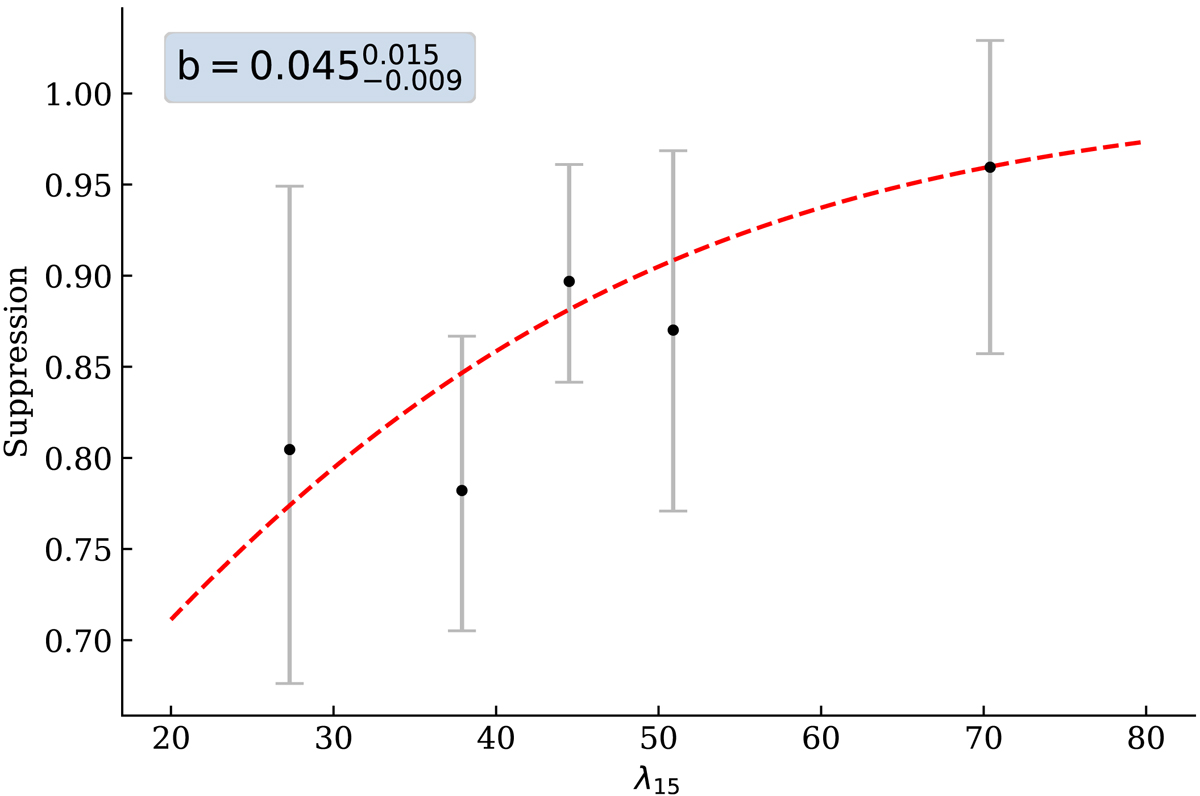
MaDCoWS to ACT ![]() suppression ratio due to miscentering based on the 96 co-detections. The position of data points on the x axis shows the center of the richness bin. The y axis is the ratio of the aperture δTCMB in the central 1.2′ radius of the MaDCoWS centered stacks to that of the ACT centered stacks, where δTCMB is the fluctuation in CMB temperature from the mean. The data have been fit to a one-parameter sigmoid model of the form
suppression ratio due to miscentering based on the 96 co-detections. The position of data points on the x axis shows the center of the richness bin. The y axis is the ratio of the aperture δTCMB in the central 1.2′ radius of the MaDCoWS centered stacks to that of the ACT centered stacks, where δTCMB is the fluctuation in CMB temperature from the mean. The data have been fit to a one-parameter sigmoid model of the form ![]() . The dashed red line shows this fit, and the legend reports b.
. The dashed red line shows this fit, and the legend reports b.
Current usage metrics show cumulative count of Article Views (full-text article views including HTML views, PDF and ePub downloads, according to the available data) and Abstracts Views on Vision4Press platform.
Data correspond to usage on the plateform after 2015. The current usage metrics is available 48-96 hours after online publication and is updated daily on week days.
Initial download of the metrics may take a while.