Fig. 5.
Download original image
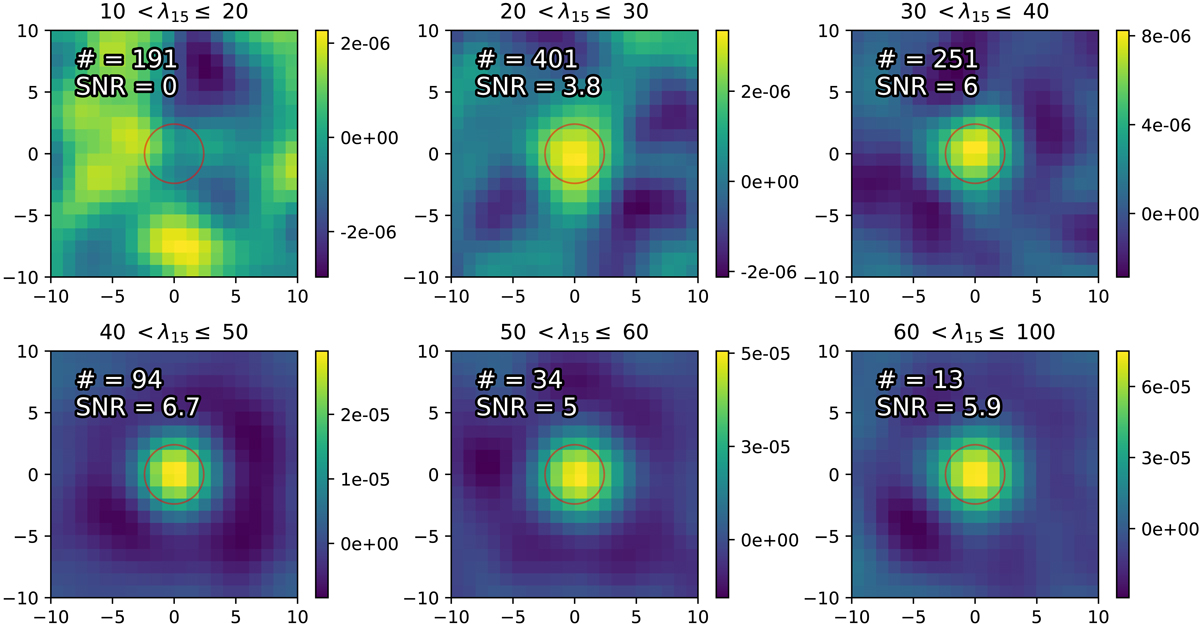
Stacks on MaDCoWS cluster positions in bins of richness on the ACT ![]() maps. The color bar scale is in units of
maps. The color bar scale is in units of ![]() . Due to the order of magnitude difference in scale maximum between bins, the scaling is not consistent between plots. While there is no detection in the 10 < λ15 ≤ 20 bin, there is a clear signal in all the other bins. The red circle indicates the central 2.4′ in diameter. The x axis shows the offset in RA in arcminutes, while the y axis shows the offset in declination in arcminutes. The text in the top left is the number of MaDCoWS cluster candidates in the stack and the S/N.
. Due to the order of magnitude difference in scale maximum between bins, the scaling is not consistent between plots. While there is no detection in the 10 < λ15 ≤ 20 bin, there is a clear signal in all the other bins. The red circle indicates the central 2.4′ in diameter. The x axis shows the offset in RA in arcminutes, while the y axis shows the offset in declination in arcminutes. The text in the top left is the number of MaDCoWS cluster candidates in the stack and the S/N.
Current usage metrics show cumulative count of Article Views (full-text article views including HTML views, PDF and ePub downloads, according to the available data) and Abstracts Views on Vision4Press platform.
Data correspond to usage on the plateform after 2015. The current usage metrics is available 48-96 hours after online publication and is updated daily on week days.
Initial download of the metrics may take a while.