Fig. 4.
Download original image
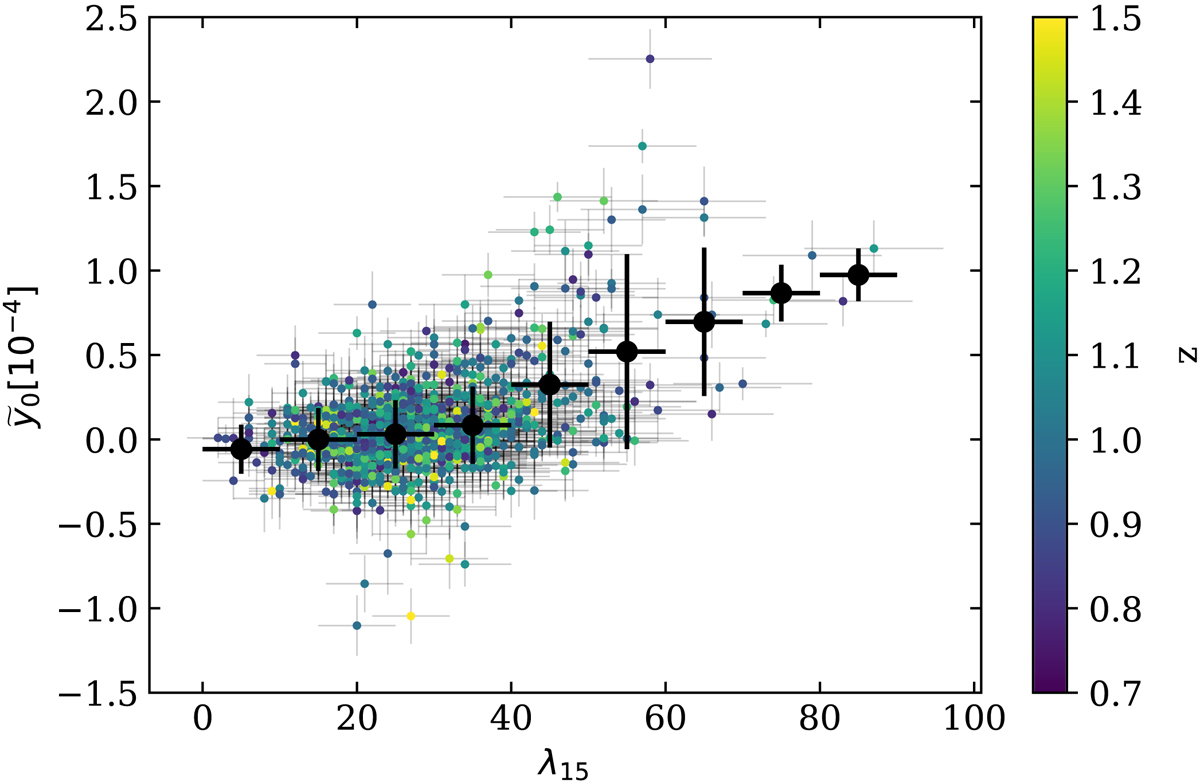
![]() –λ15 relation for the forced photometry ACT×MaDCoWS catalog. The color bar on the right indicates the redshift of each candidate. The black points indicate the average
–λ15 relation for the forced photometry ACT×MaDCoWS catalog. The color bar on the right indicates the redshift of each candidate. The black points indicate the average ![]() in bins of richness. We note that these are not quite the same as those computed from stacking in Fig. 5 as those do not include the co-detections. See Sect. 4 for a discussion of why they were not included. The binned
in bins of richness. We note that these are not quite the same as those computed from stacking in Fig. 5 as those do not include the co-detections. See Sect. 4 for a discussion of why they were not included. The binned ![]() uncertainties were computed via bootstrapping, while the λ15 error bars simply show the bin width. The redshift given is the ACT catalog redshift for those clusters detected in ACT; otherwise, it is the MaDCoWS-reported redshift.
uncertainties were computed via bootstrapping, while the λ15 error bars simply show the bin width. The redshift given is the ACT catalog redshift for those clusters detected in ACT; otherwise, it is the MaDCoWS-reported redshift.
Current usage metrics show cumulative count of Article Views (full-text article views including HTML views, PDF and ePub downloads, according to the available data) and Abstracts Views on Vision4Press platform.
Data correspond to usage on the plateform after 2015. The current usage metrics is available 48-96 hours after online publication and is updated daily on week days.
Initial download of the metrics may take a while.