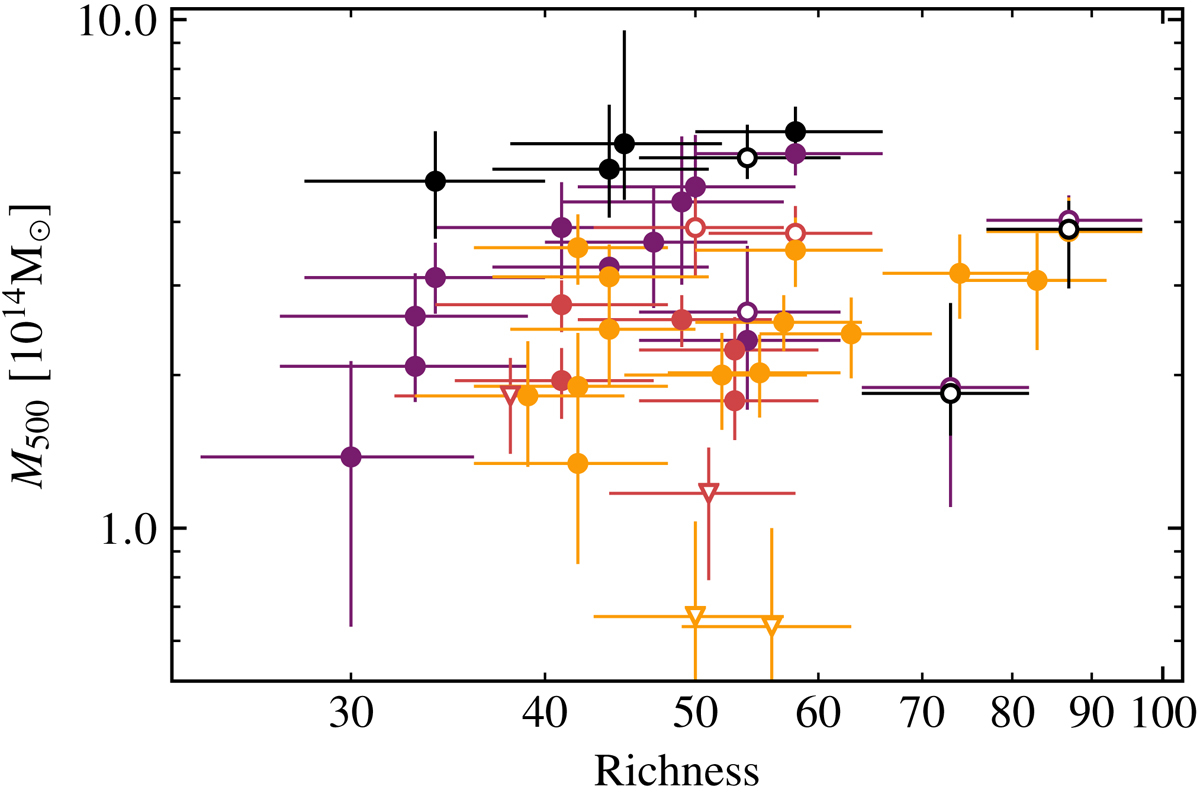
Fig. 3.
Download original image
Mass vs. richness relation for a selection of MaDCoWS clusters with SZ mass estimates. The purple circles correspond to the CARMA MaDCoWS cluster sample from Gonzalez et al. (2019a). The VACA LoCA points from Di Mascolo et al. (2020) are shown in red, and the MUSTANG2 measurements from Dicker et al. (2020) are shown in orange. The black data points are Chandra observations of MaDCoWS clusters. Points that are open are known active mergers, and points that are represented with triangles are consistent with no signal. We note that Fig. 12 provides a similar comparison for the complete sample of MaDCoWS candidates in the ACT survey footprint.
Current usage metrics show cumulative count of Article Views (full-text article views including HTML views, PDF and ePub downloads, according to the available data) and Abstracts Views on Vision4Press platform.
Data correspond to usage on the plateform after 2015. The current usage metrics is available 48-96 hours after online publication and is updated daily on week days.
Initial download of the metrics may take a while.