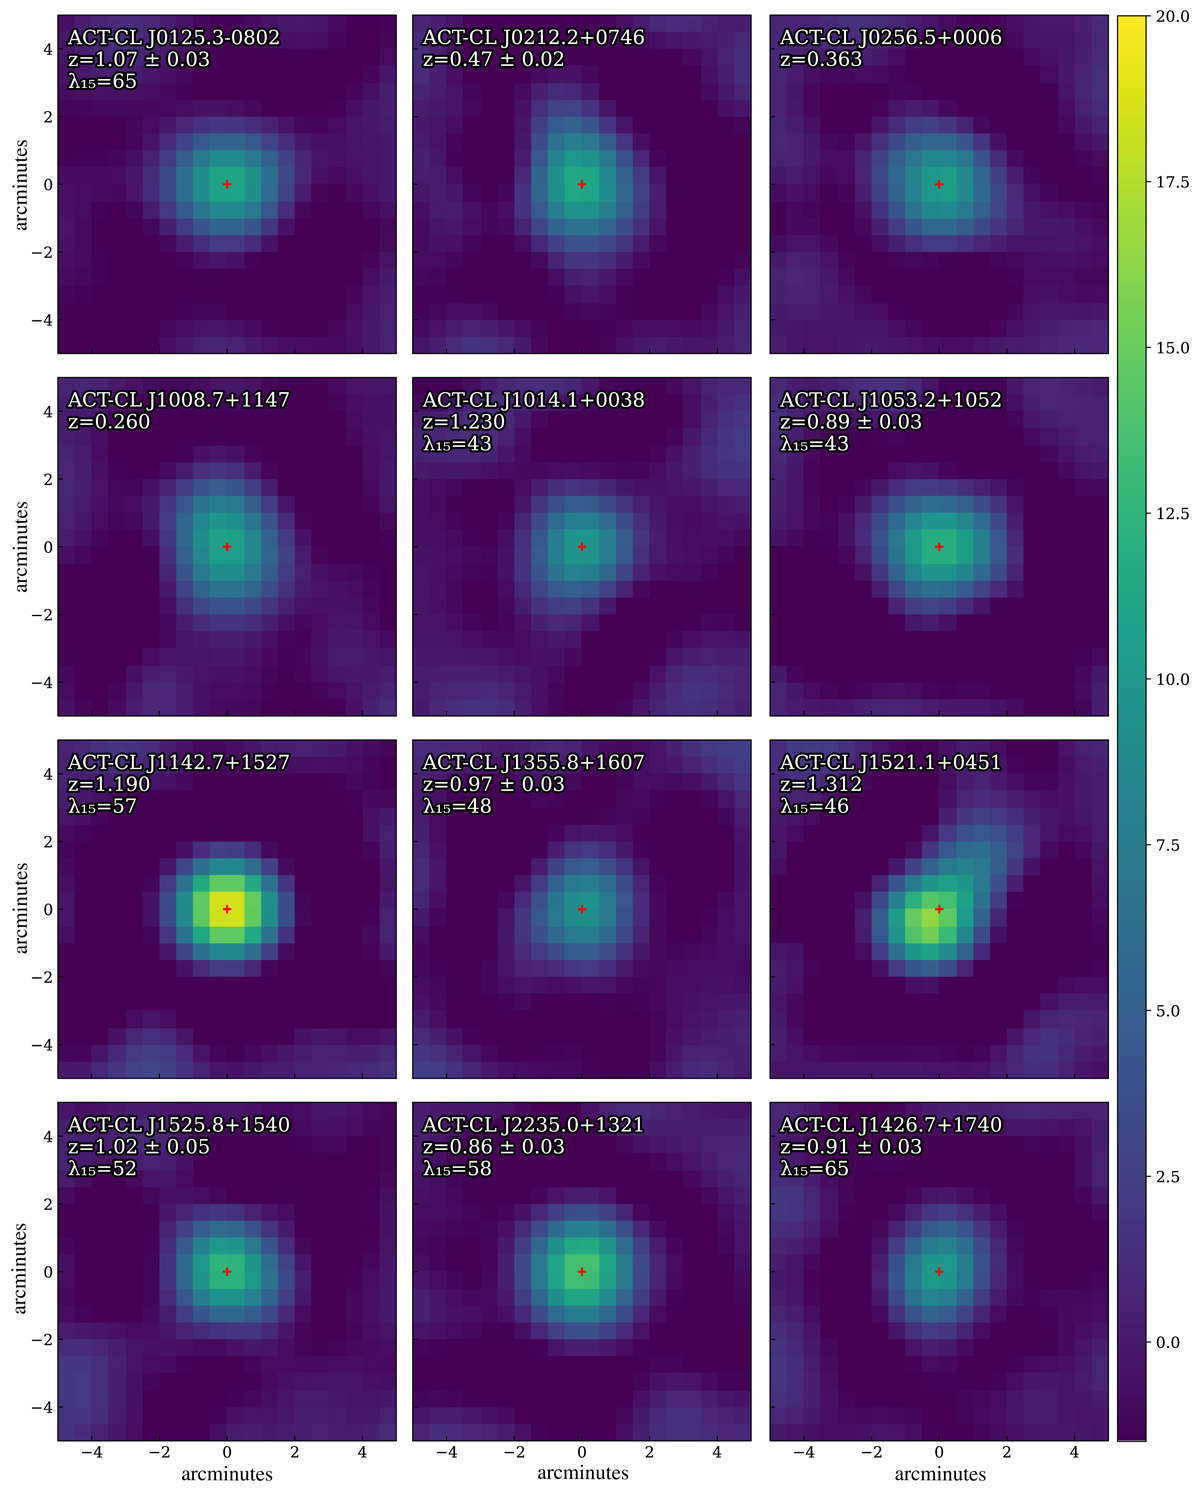
Fig. 2.
Download original image
ACT S/N maps of the dozen highest-significance co-detections, where the S/N is with respect to ![]() . Each panel notes the ACT cluster name and redshift from Hilton et al. (2021). Some of these clusters do not have a measured MaDCoWS richness, and as such none is reported. The three clusters lacking richness measures were found to be lower-redshift clusters. Red crosses denote the ACT-identified cluster center. The color bar scale is in units of
. Each panel notes the ACT cluster name and redshift from Hilton et al. (2021). Some of these clusters do not have a measured MaDCoWS richness, and as such none is reported. The three clusters lacking richness measures were found to be lower-redshift clusters. Red crosses denote the ACT-identified cluster center. The color bar scale is in units of ![]() .
.
Current usage metrics show cumulative count of Article Views (full-text article views including HTML views, PDF and ePub downloads, according to the available data) and Abstracts Views on Vision4Press platform.
Data correspond to usage on the plateform after 2015. The current usage metrics is available 48-96 hours after online publication and is updated daily on week days.
Initial download of the metrics may take a while.