Fig. 16.
Download original image
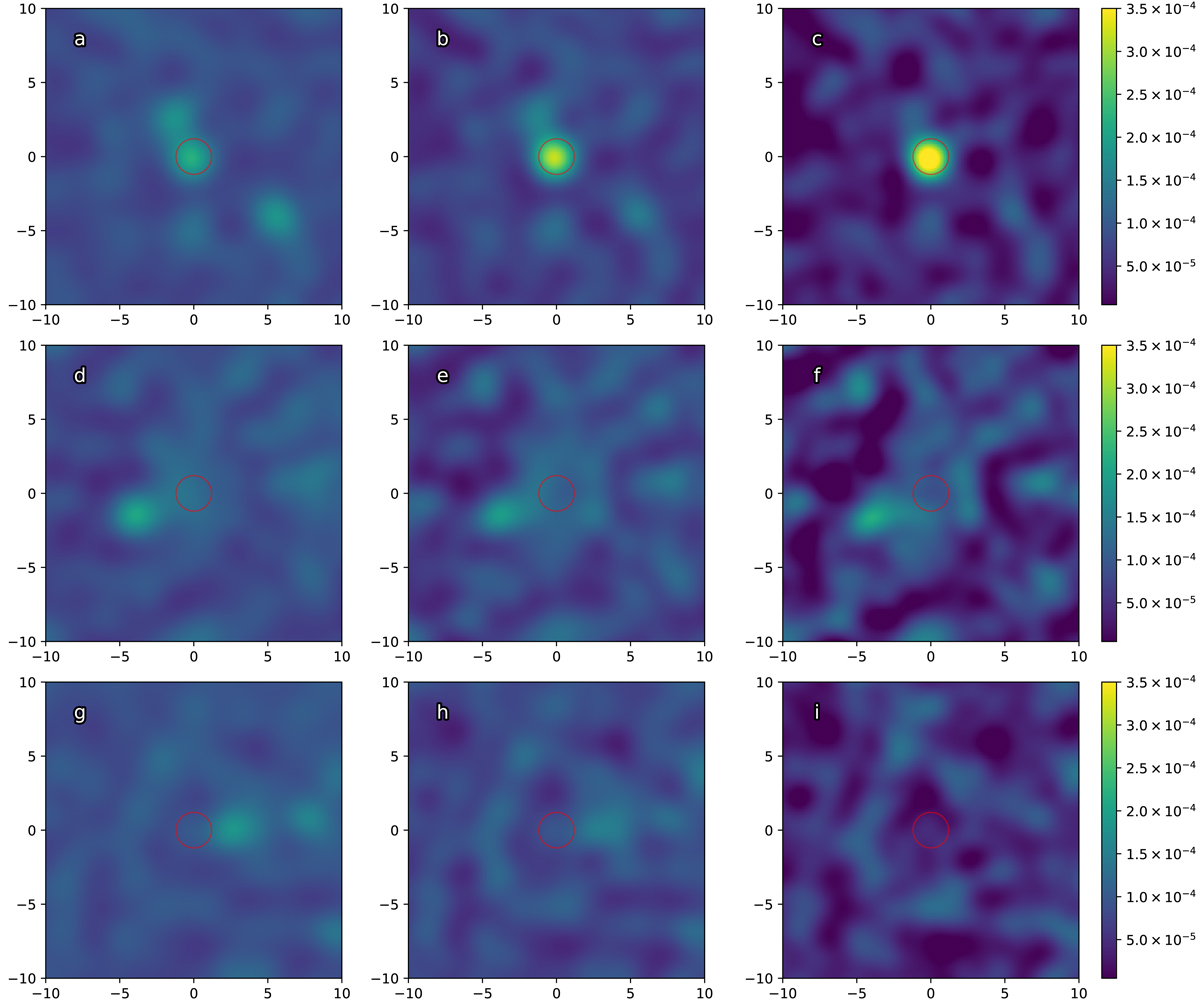
Stacks at 250, 350, and 500 μm (from left to right) on MaDCoWS (a, b, c) and ACT cluster locations (d, e, f), as well as a set of random locations (g, h, i) in the H-ATLAS data set. See Sect. 5.2 for details. The x axis of each plot is aligned with RA, while the y axis is aligned with declination; both are in units of arcmin. The color bars are in units of MJy sr−1. The red circles are 1.2′ in radius, the scale inside which we assigned excess flux density as being due to the cluster stack.
Current usage metrics show cumulative count of Article Views (full-text article views including HTML views, PDF and ePub downloads, according to the available data) and Abstracts Views on Vision4Press platform.
Data correspond to usage on the plateform after 2015. The current usage metrics is available 48-96 hours after online publication and is updated daily on week days.
Initial download of the metrics may take a while.