Free Access
Fig. 15.
Download original image
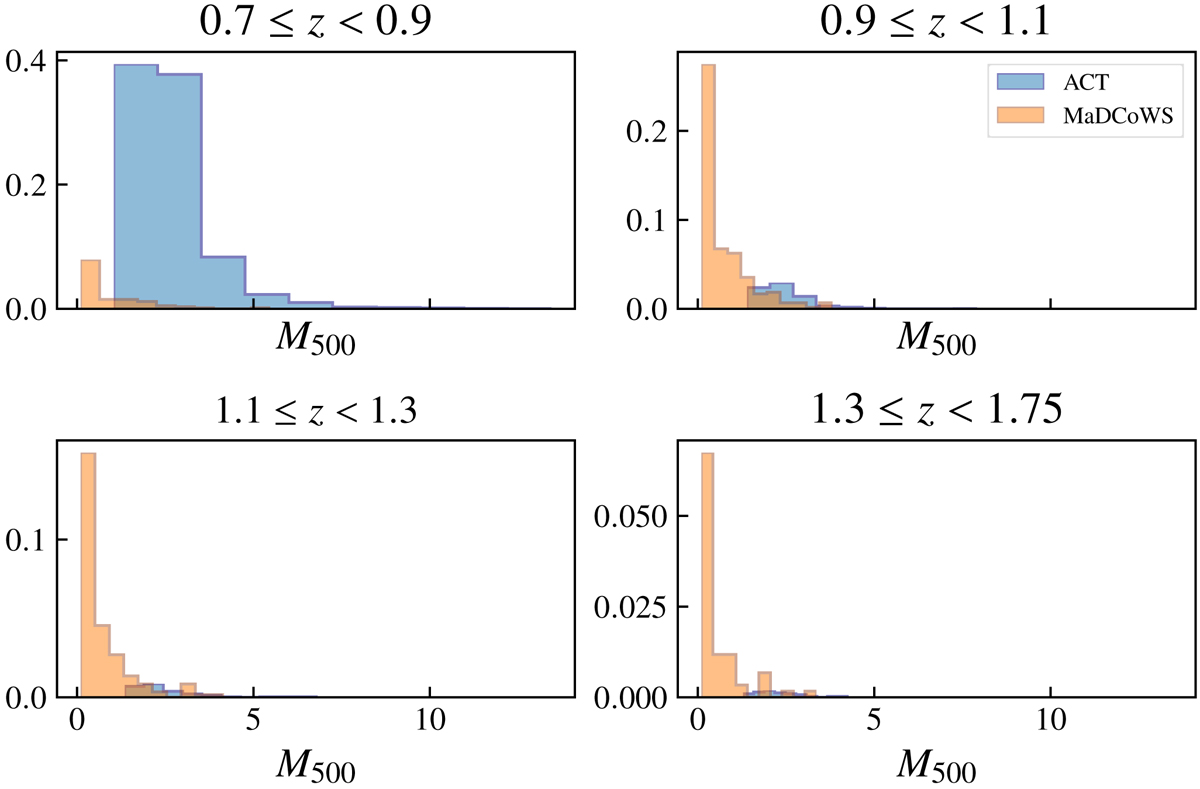
M500 of ACT clusters vs. MaDCoWS in the same redshift ranges. These distributions suggest that ACT clusters are skewed toward lower redshifts, while the MaDCoWS distribution is even across higher redshifts. In addition, MaDCoWS clusters tend to be less massive than ACT clusters at a given redshift.
Current usage metrics show cumulative count of Article Views (full-text article views including HTML views, PDF and ePub downloads, according to the available data) and Abstracts Views on Vision4Press platform.
Data correspond to usage on the plateform after 2015. The current usage metrics is available 48-96 hours after online publication and is updated daily on week days.
Initial download of the metrics may take a while.