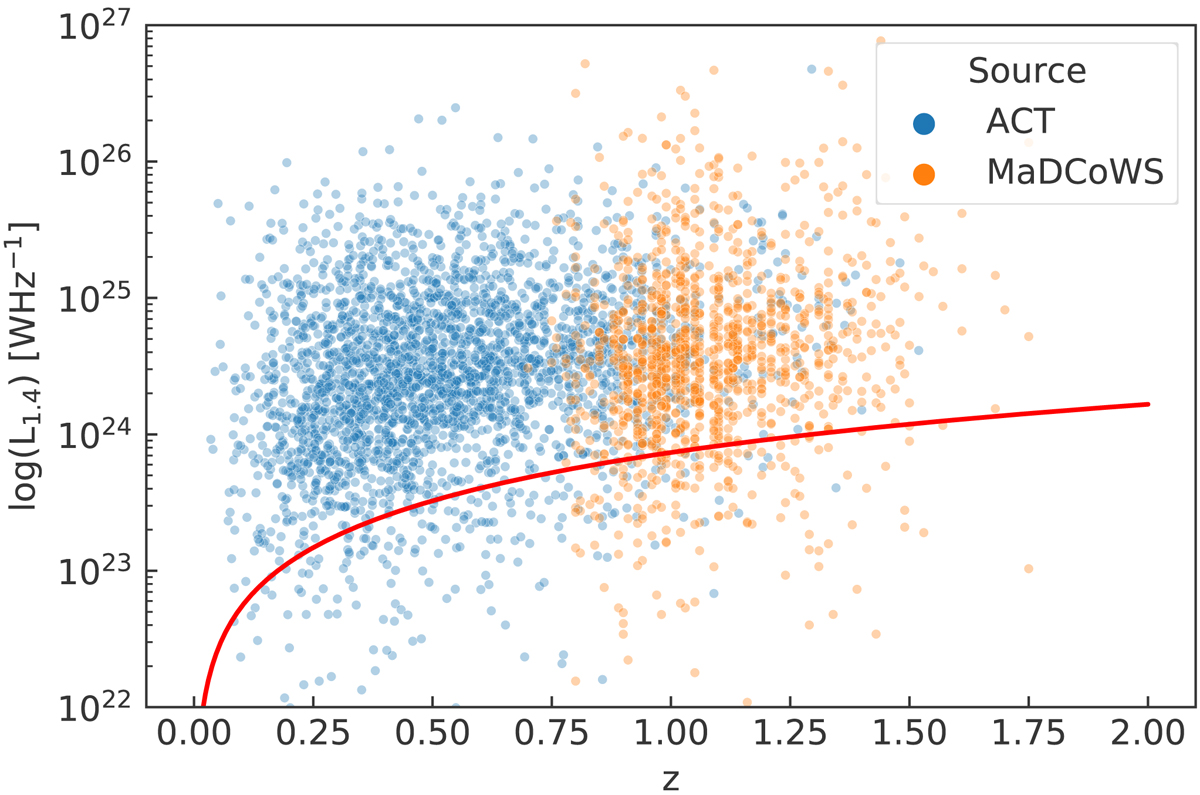
Fig. 11.
Download original image
Intrinsic radio luminosities at 1.4 GHz for ACT (blue, 3341 clusters) and MaDCoWS (orange, 1780 clusters). The red line shows a 0.3 mJy flux density at 1.4 GHz in the observed frame of reference converted to 1.4 GHz in the emitted frame of reference for the given z according to Eq. (10), and assuming a spectral index of −0.91. The choice of 0.3 mJy corresponds to the variance of the background aperture flux density in the NVSS maps for a 1.2′ radius aperture, and thus roughly corresponds to the noise floor for our background subtracted fluxes. Therefore, the red line should guide the eye as to which radio luminosities are above the noise. We note that many clusters are not shown as they have very low or negative values for their radio fluxes due to subtraction of the background.
Current usage metrics show cumulative count of Article Views (full-text article views including HTML views, PDF and ePub downloads, according to the available data) and Abstracts Views on Vision4Press platform.
Data correspond to usage on the plateform after 2015. The current usage metrics is available 48-96 hours after online publication and is updated daily on week days.
Initial download of the metrics may take a while.