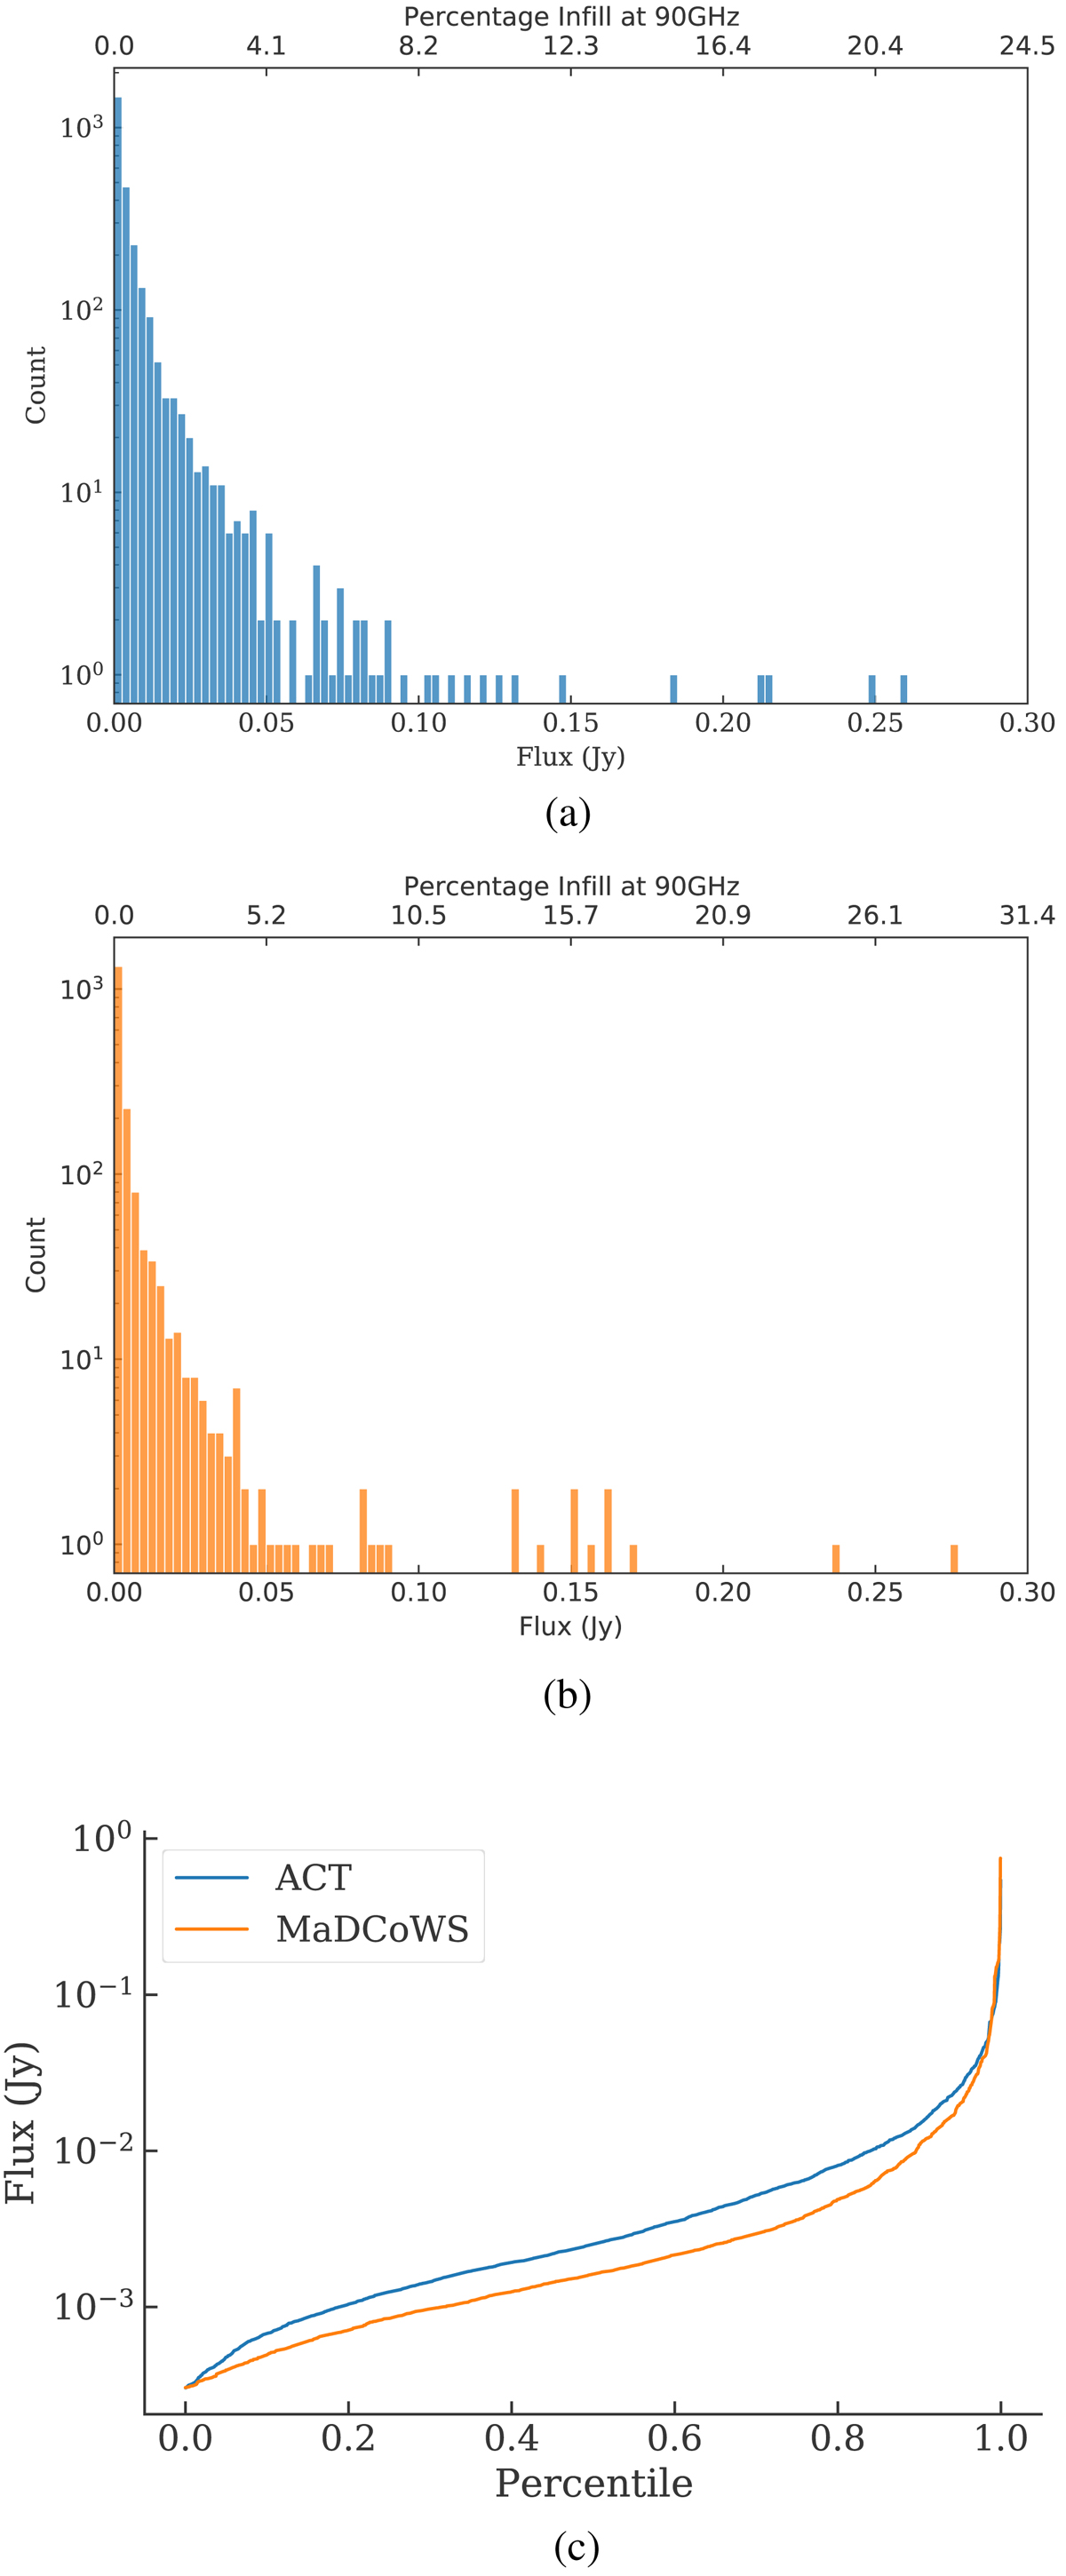
Fig. 10.
Download original image
Histograms of the 1.4 GHz aperture flux density of the ACT (a) and MaDCoWS (b) cluster catalogs. Panel c: normalized cumulative histogram of the same data, cut at the aperture noise of 0.3 mJy, to better illustrate the difference in infill between the two samples. The fluxes shown are all for a 1.2′ radius aperture, while the percentage infill is the approximate infill of the SZ signal as described in Sect. 7.1.2. We note that due to differences in average redshift and spectral index of the ACT and MaDCoWS clusters, the same measured flux density at 1.4 GHz does not correspond to the same percentage infill. The ACT clusters show on average significantly more radio infill at 1.4 GHz than their MaDCoWS analogs.
Current usage metrics show cumulative count of Article Views (full-text article views including HTML views, PDF and ePub downloads, according to the available data) and Abstracts Views on Vision4Press platform.
Data correspond to usage on the plateform after 2015. The current usage metrics is available 48-96 hours after online publication and is updated daily on week days.
Initial download of the metrics may take a while.