Fig. 1.
Download original image
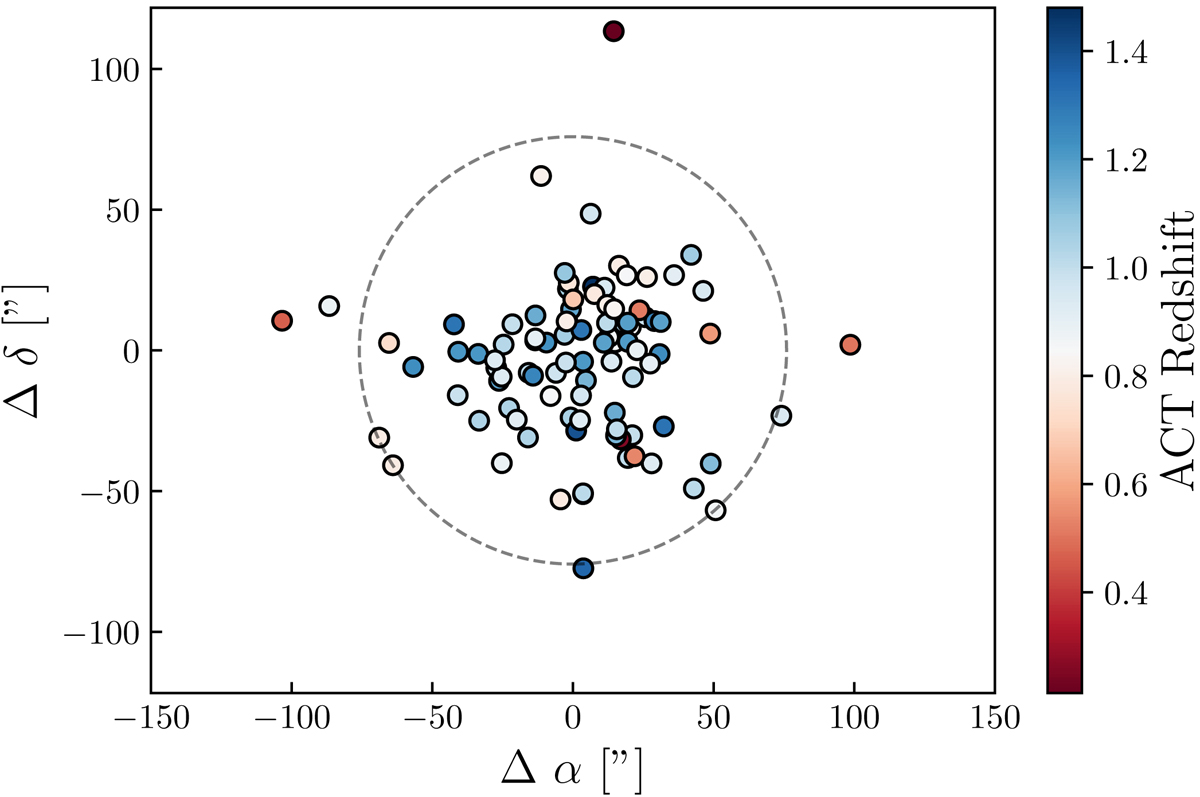
Offsets in the right ascension and declination of ACT clusters (Hilton et al. 2021) and their co-detected MaDCoWS counterparts (Gonzalez et al. 2019b). The color bar indicates the redshift of the co-detection as recorded by ACT in the DR5 cluster catalog. The black-dotted circle is the radius (1.2′) that includes 89 (95%) of the co-detections.
Current usage metrics show cumulative count of Article Views (full-text article views including HTML views, PDF and ePub downloads, according to the available data) and Abstracts Views on Vision4Press platform.
Data correspond to usage on the plateform after 2015. The current usage metrics is available 48-96 hours after online publication and is updated daily on week days.
Initial download of the metrics may take a while.