Fig. 4.
Download original image
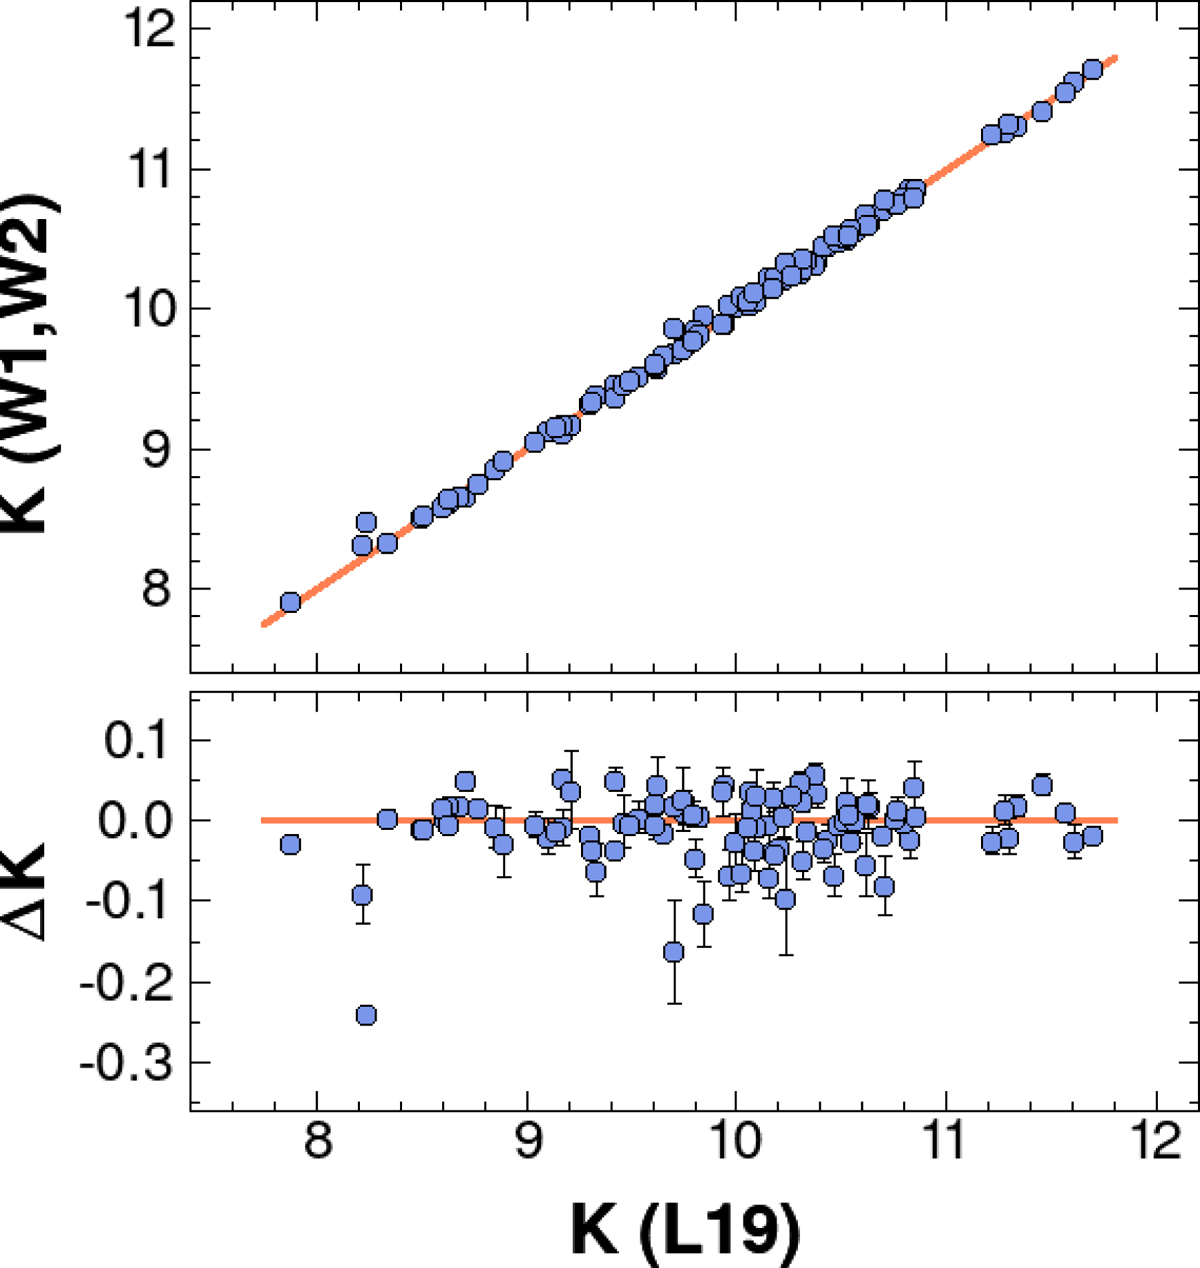
Calibration of the unWISE (Schlafly et al. 2019) W1, W2 magnitudes to the 2MASS K magnitudes of the RR Lyrae sample of Layden et al. (2019). On the vertical axis in the upper panel, we plot dereddened magnitudes K(W1, W2) = K0 (see Eq. (4)). The reference levels are shown by continuous lines, ΔK = K(L19)−K(W1, W2). The strongest outlier in the lower panel is AR Per, with an outstandingly high reddening of E(B − V) = 1.110.
Current usage metrics show cumulative count of Article Views (full-text article views including HTML views, PDF and ePub downloads, according to the available data) and Abstracts Views on Vision4Press platform.
Data correspond to usage on the plateform after 2015. The current usage metrics is available 48-96 hours after online publication and is updated daily on week days.
Initial download of the metrics may take a while.