Fig. 6.
Download original image
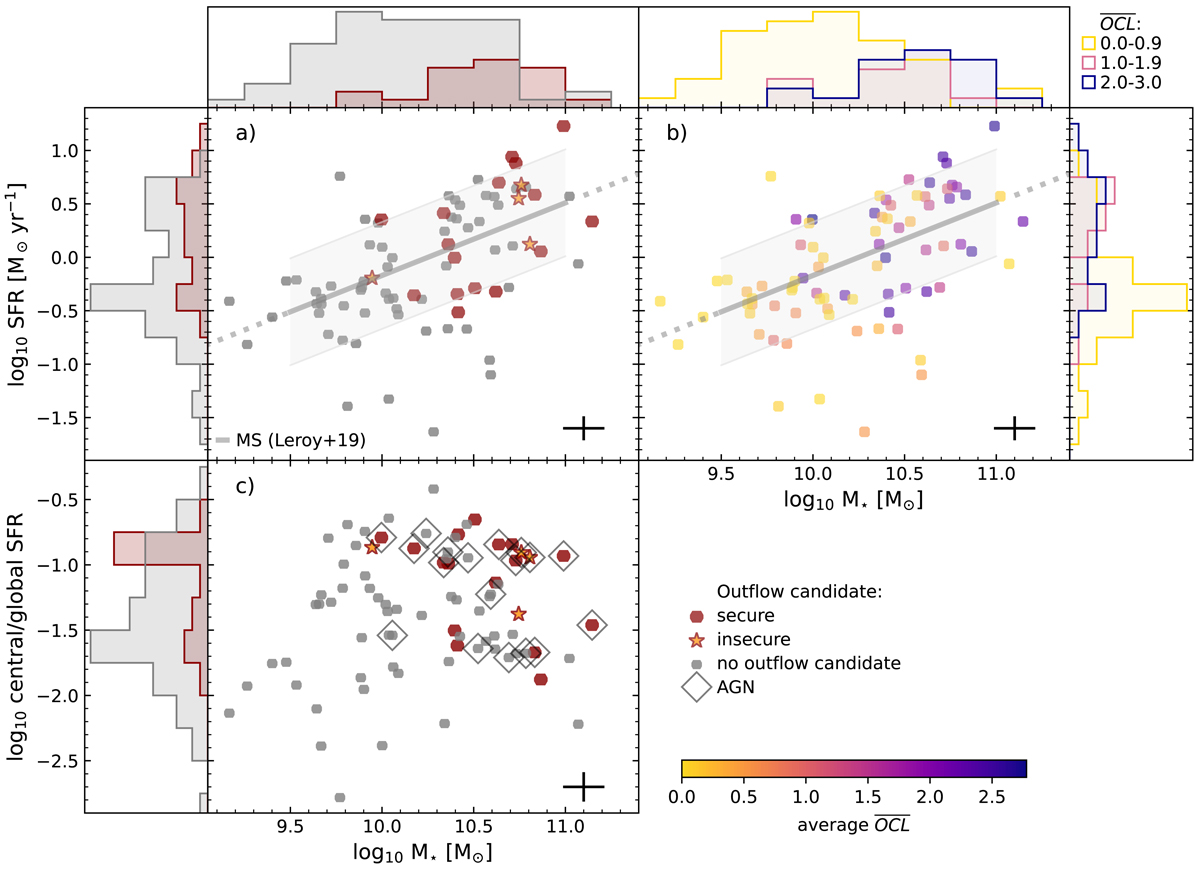
(a) Distribution of PHANGS outflow candidates (secure candidate: red hexagon, otherwise: orange star) and non-outflow galaxies (gray hexagon) along the star-forming main sequence. The histograms show the distribution over stellar mass (top) and SFR (left) for outflow candidates (red, all candidates combined) and galaxies without outflows (gray). The main sequence according to Leroy et al. (2019) is added for comparison (gray solid line) with a width of 0.5 dex (gray shaded area) and extrapolated to larger and smaller stellar masses (dotted gray line). (b) Distribution of PHANGS galaxies along the main sequence of star-forming galaxies. The ![]() is shown by color. A dark color represents a large
is shown by color. A dark color represents a large ![]() (e.g., class 3), thus showing host galaxies with high probabilities to possess molecular outflows. Light colors represent low
(e.g., class 3), thus showing host galaxies with high probabilities to possess molecular outflows. Light colors represent low ![]() (e.g., class 0), thus no or only tentative outflow signatures are present in these galaxies. The histograms show the distribution over stellar mass (top) and SFR (right) for three
(e.g., class 0), thus no or only tentative outflow signatures are present in these galaxies. The histograms show the distribution over stellar mass (top) and SFR (right) for three ![]() bins. (c) Ratio of central-to-global SFR as a function of stellar mass for PHANGS galaxies likely to host a central molecular outflow (secure candidate: red hexagon, otherwise: orange star) or not (gray hexagon). Histograms show the distribution of all outflow candidates (red) compared to galaxies without outflow signatures (gray) in stellar mass (top) and SFR ratio (left). AGN are marked by an open black diamond. For all plots the median uncertainty for individual data points is shown in the lower right corner.
bins. (c) Ratio of central-to-global SFR as a function of stellar mass for PHANGS galaxies likely to host a central molecular outflow (secure candidate: red hexagon, otherwise: orange star) or not (gray hexagon). Histograms show the distribution of all outflow candidates (red) compared to galaxies without outflow signatures (gray) in stellar mass (top) and SFR ratio (left). AGN are marked by an open black diamond. For all plots the median uncertainty for individual data points is shown in the lower right corner.
Current usage metrics show cumulative count of Article Views (full-text article views including HTML views, PDF and ePub downloads, according to the available data) and Abstracts Views on Vision4Press platform.
Data correspond to usage on the plateform after 2015. The current usage metrics is available 48-96 hours after online publication and is updated daily on week days.
Initial download of the metrics may take a while.