Fig. 3.
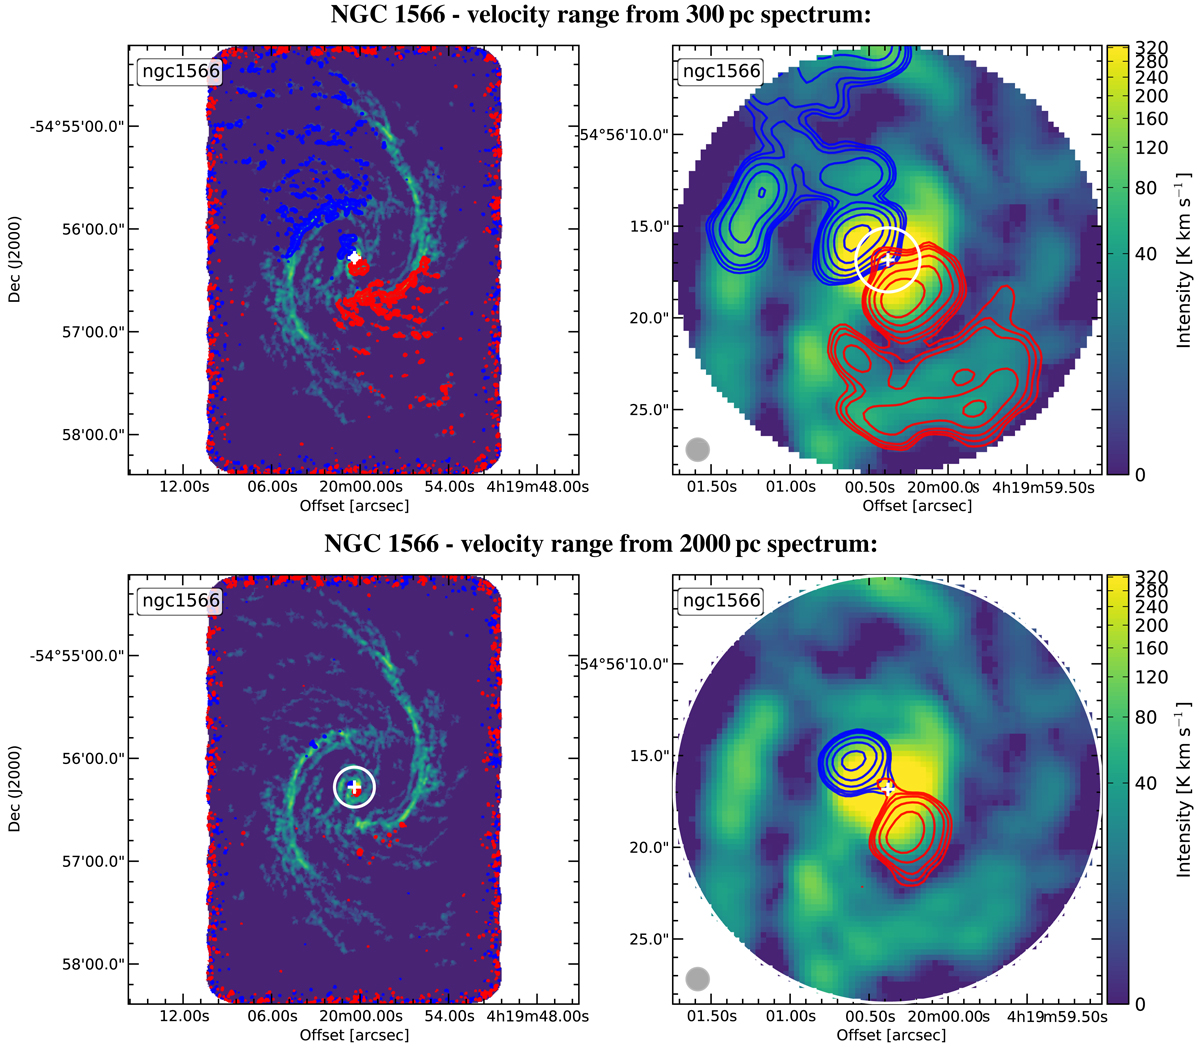
Download original image
Line-wing maps for NGC 1566. Left panels: full moment-0 map available with the integrated lwms (red- and blue-shifted contours, respectively) overplotted. Right panels: zoom-in of the central region with 2 kpc diameter. The beam size is shown as a gray circle in the lower left corner of the zoom images. Center positions are indicated with a white plus. The lwms shown in the upper panels are derived by integrating over the velocity range selected from the 300 pc spectrum as described in Sect. 3.2.3, the lower panels use the 2 kpc annulus spectrum. A white circle indicates the size over which the corresponding spectrum is taken. These 4 panels together received an OCLlwm of 1, 1, 0 from the three inspectors. The contour levels are selected to be the same as for the pv–diagrams, with the noise being calculated for the zoom images, not for the full maps. The underestimation of the noise at the edges of the full map (left panels) is evident, however, it does not affect our search for central outflows.
Current usage metrics show cumulative count of Article Views (full-text article views including HTML views, PDF and ePub downloads, according to the available data) and Abstracts Views on Vision4Press platform.
Data correspond to usage on the plateform after 2015. The current usage metrics is available 48-96 hours after online publication and is updated daily on week days.
Initial download of the metrics may take a while.