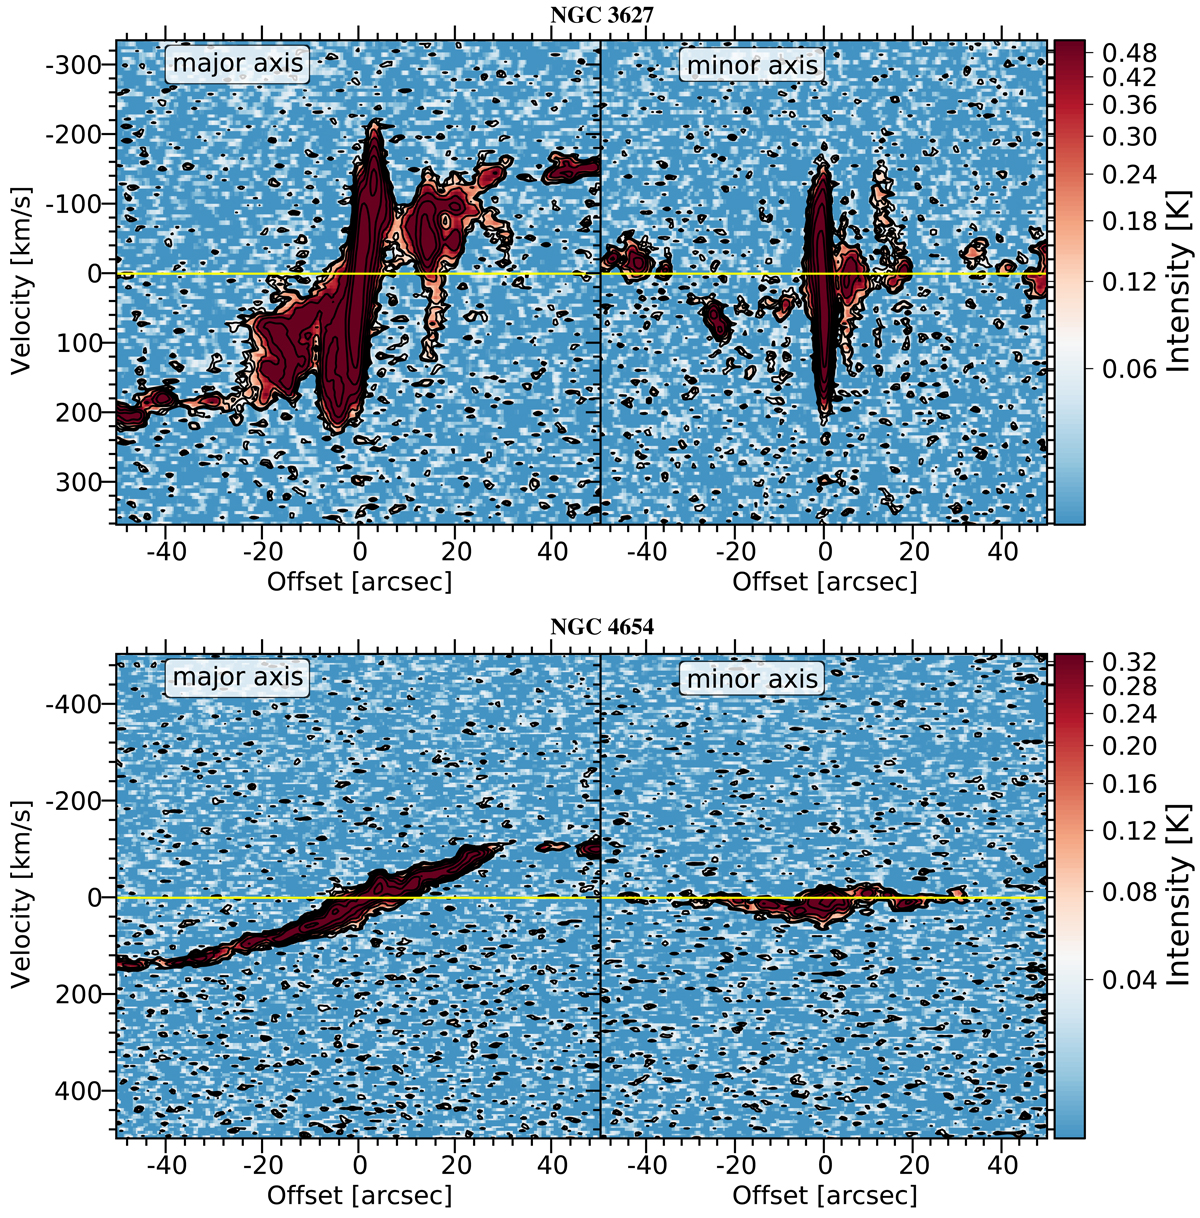
Fig. 2.
Download original image
Example pv–diagrams along the major and minor kinematic axes of NGC 3627 (top) and NGC 4654 (bottom) used to search for outflows. The color scale represents the intensity at a given position along the offset averaged over a width of 3 pixels. The contours are multiples of the noise at 2.5σ, 3.5σ, followed by niσ with ni = 2ni − 1, for n0 = 2.5σ and i = 1, 2, 3, …. The color range is saturated to emphasize the faint emission we are interested in. The pv–diagrams of NGC 3627 (NGC 4654) correspond to OCLs of 3, 2, 2 (0, 0, 0) from the three different inspectors. The systemic velocity (yellow horizontal line) is added for comparison and is subtracted from the velocity axis.
Current usage metrics show cumulative count of Article Views (full-text article views including HTML views, PDF and ePub downloads, according to the available data) and Abstracts Views on Vision4Press platform.
Data correspond to usage on the plateform after 2015. The current usage metrics is available 48-96 hours after online publication and is updated daily on week days.
Initial download of the metrics may take a while.