Fig. B.1.
Download original image
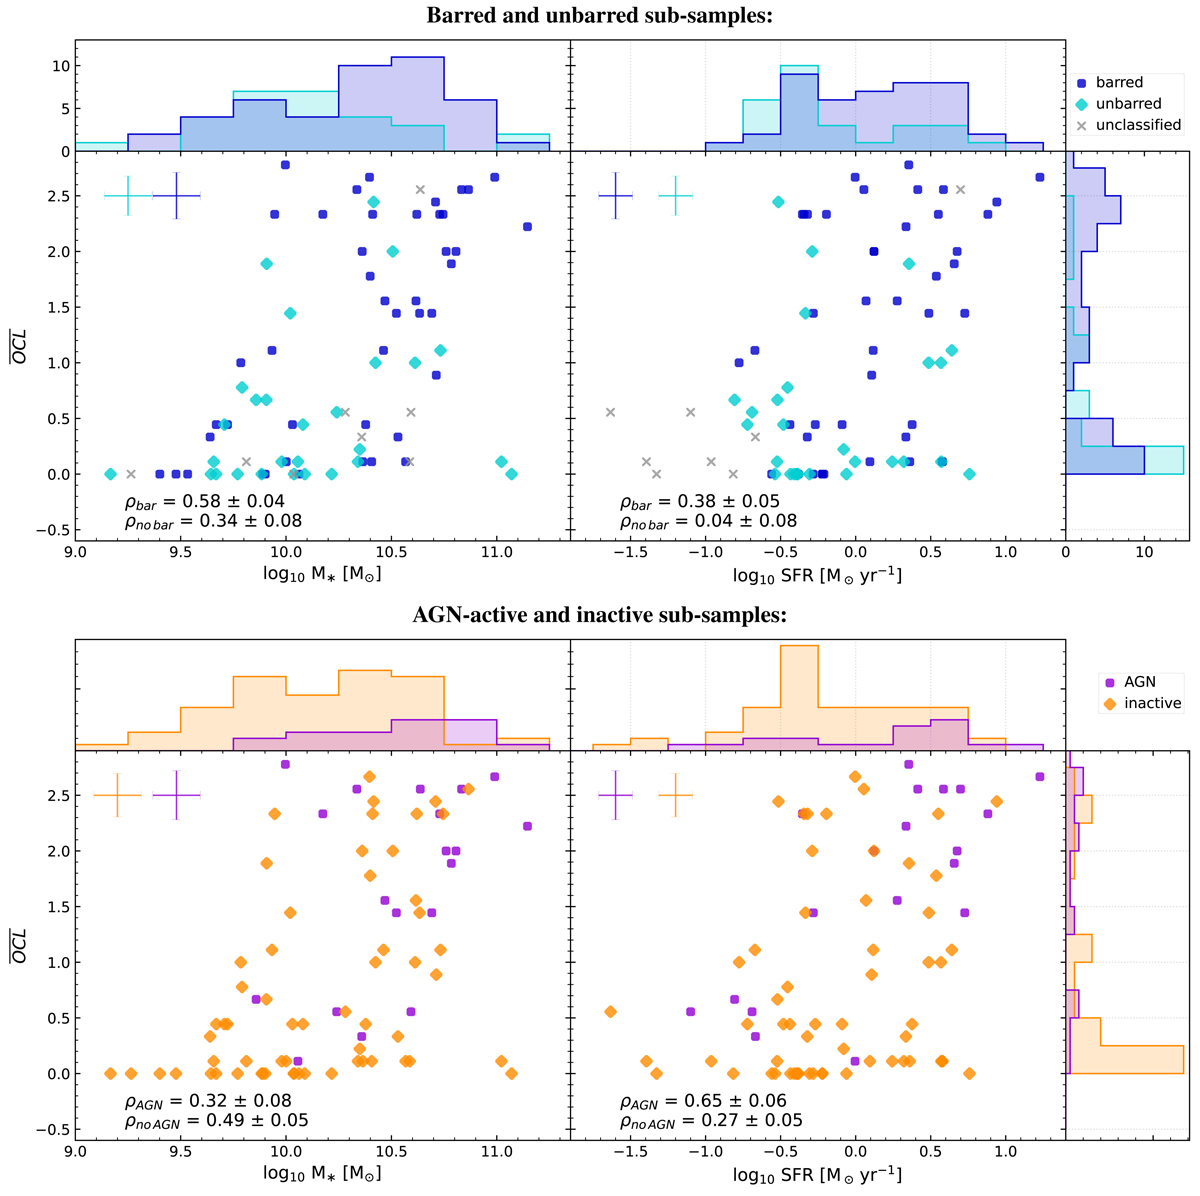
![]() dependence on the presence of a stellar bar or AGN. Top row:
dependence on the presence of a stellar bar or AGN. Top row: ![]() s of PHANGS galaxies as a function of the host galaxy’s stellar mass (left) or SFR (right) for barred (blue circles) and unbarred galaxies (cyan diamonds) (galaxies without a bar classification: grey cross). Histograms of the barred (blue) and unbarred (cyan) sub-sample are added for stellar mass (top left), SFR (top right panel) and
s of PHANGS galaxies as a function of the host galaxy’s stellar mass (left) or SFR (right) for barred (blue circles) and unbarred galaxies (cyan diamonds) (galaxies without a bar classification: grey cross). Histograms of the barred (blue) and unbarred (cyan) sub-sample are added for stellar mass (top left), SFR (top right panel) and ![]() (far right panel). Bottom row: Analogous plot for galaxies hosting an AGN (purple circles) or not (orange diamonds). Histograms of the AGN (purple) and non-AGN (orange) sub-samples are added for stellar mass (top left), SFR (top right) and
(far right panel). Bottom row: Analogous plot for galaxies hosting an AGN (purple circles) or not (orange diamonds). Histograms of the AGN (purple) and non-AGN (orange) sub-samples are added for stellar mass (top left), SFR (top right) and ![]() s (far right panel). Spearman rank correlation coefficient between
s (far right panel). Spearman rank correlation coefficient between ![]() and galaxy property are listed at the bottom of each panel, for the respective sub-samples (ρbar, ρno bar, ρAGN, ρno AGN). For comparison, the Spearman rank correlation coefficient of the full sample between
and galaxy property are listed at the bottom of each panel, for the respective sub-samples (ρbar, ρno bar, ρAGN, ρno AGN). For comparison, the Spearman rank correlation coefficient of the full sample between ![]() and stellar mass is ρM⋆ = 0.56 ± 0.03 and between
and stellar mass is ρM⋆ = 0.56 ± 0.03 and between ![]() and SFR is ρSFR = 0.40 ± 0.03. Typical uncertainties for
and SFR is ρSFR = 0.40 ± 0.03. Typical uncertainties for ![]() and the galaxy property are added in the upper left corner of each panel.
and the galaxy property are added in the upper left corner of each panel.
Current usage metrics show cumulative count of Article Views (full-text article views including HTML views, PDF and ePub downloads, according to the available data) and Abstracts Views on Vision4Press platform.
Data correspond to usage on the plateform after 2015. The current usage metrics is available 48-96 hours after online publication and is updated daily on week days.
Initial download of the metrics may take a while.