Fig. 1.
Download original image
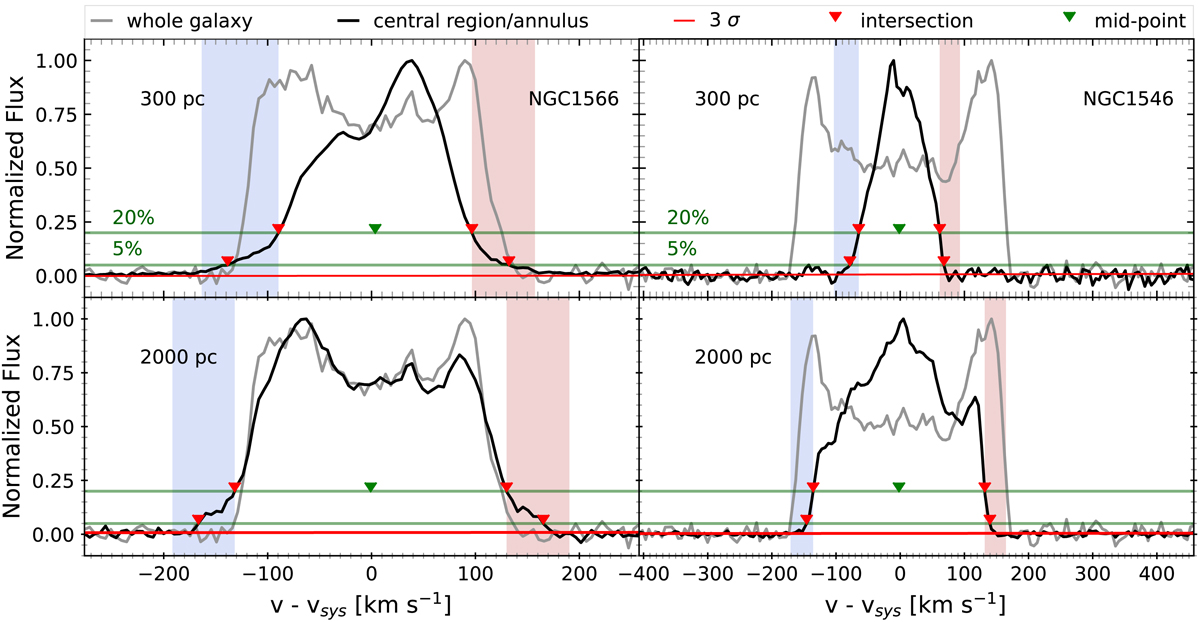
Spectra of NGC 1566 and NGC 1546 used for visual classification of outflow candidates. Integrated and normalized spectra (black solid line) of the central regions, i.e., the inner 300 pc in diameter (top panels), and using annuli covering diameter with 300 pc < dgal < 2 kpc (bottom panels). For comparison, the integrated spectrum from the whole galaxy normalized to a peak of unity is shown by a gray line. The red solid lines represent the interpolated 3σ noise level for the central region/annulus. The mid-points of the 20% intersections of the peak (green triangle) are shown for comparison. Velocity has the systemic velocity subtracted. The transparent blue and red areas represent the velocity ranges over which the blue- and red-shifted line-wing maps (Sect. 3.2.3) are integrated over. These areas are selected to correspond to the velocity at 20% of the peak from the central spectrum out to the velocity at 5% of the peak plus an empirically determined additional 25 km s−1 to take into account faint emission at low significance. The green solid lines mark the 20% and 5% peak levels, respectively. Intersections with the central spectrum are given as red triangles. The spectra of NGC 1566 received OCLs of 3, 3, 2 for the 300 pc spectrum and 2, 2, 3 for the 2 kpc-annulus spectrum from all inspectors due to the pronounced line wings. Both images of NGC 1546 received an OCL of 0 from all inspectors for both apertures as no broad wings are evident.
Current usage metrics show cumulative count of Article Views (full-text article views including HTML views, PDF and ePub downloads, according to the available data) and Abstracts Views on Vision4Press platform.
Data correspond to usage on the plateform after 2015. The current usage metrics is available 48-96 hours after online publication and is updated daily on week days.
Initial download of the metrics may take a while.