Fig. B.1.
Download original image
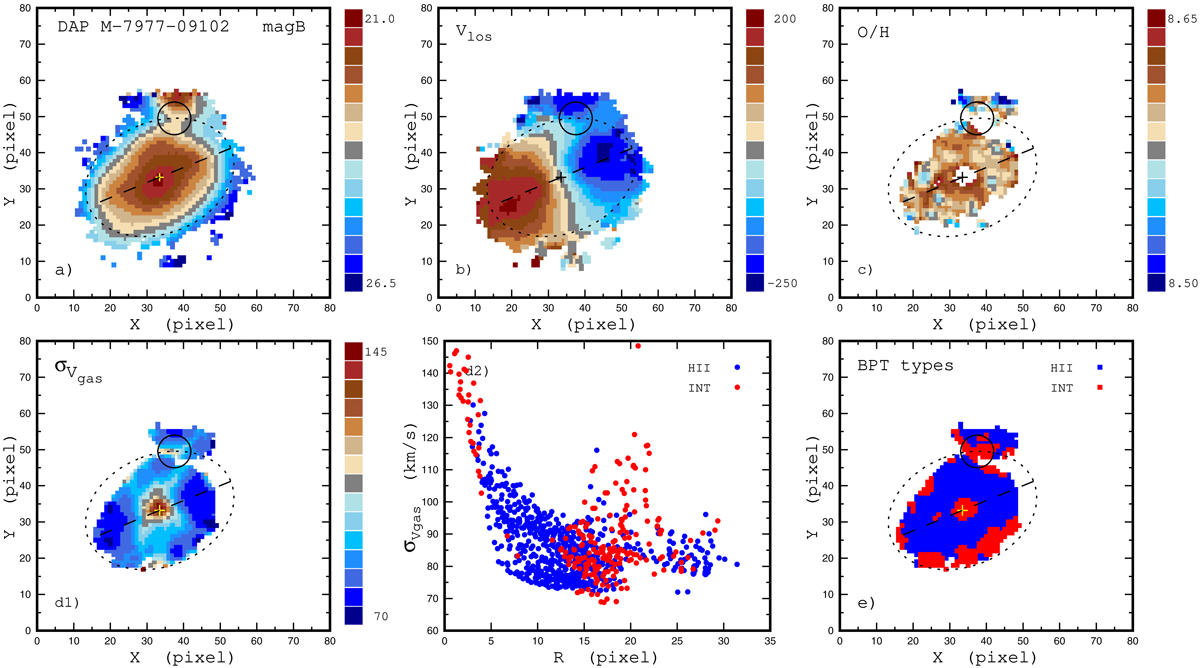
Properties of the MaNGA galaxy M-7977-09102 for the DAP measurements. Panel a: distribution of the surface brightness in the photometric B-band across the image of the galaxy in sky coordinates (pixels). The value of the surface brightness is color-coded. The plus sign (or cross in some cases) shows the kinematic center of the galaxy, the dashed line is the major kinematic axis, the dotted ellipse indicates the optical radius the galaxy. The solid ring marks the position of the spot with the enhanced gas velocity dispersion. The size of the ring corresponds to the point spread function of the MaNGA measurements (2.5 arcsec or 5 pixel). Panel b: line-of-sight Hα velocity Vlos field. Panel c: oxygen abundance map. Panel d1: gas velocity dispersion σ distribution across the image of the galaxy in sky coordinates. Panel d2: gas velocity dispersion as a function of radius for individual spaxels. The BPT type of the spectra is color-coded. Panel e: locations of the spaxels with spectra of different BPT types (the AGN-like, H II-region-like, and intermediate) on the image of the galaxy.
Current usage metrics show cumulative count of Article Views (full-text article views including HTML views, PDF and ePub downloads, according to the available data) and Abstracts Views on Vision4Press platform.
Data correspond to usage on the plateform after 2015. The current usage metrics is available 48-96 hours after online publication and is updated daily on week days.
Initial download of the metrics may take a while.