Fig. A.2
Download original image
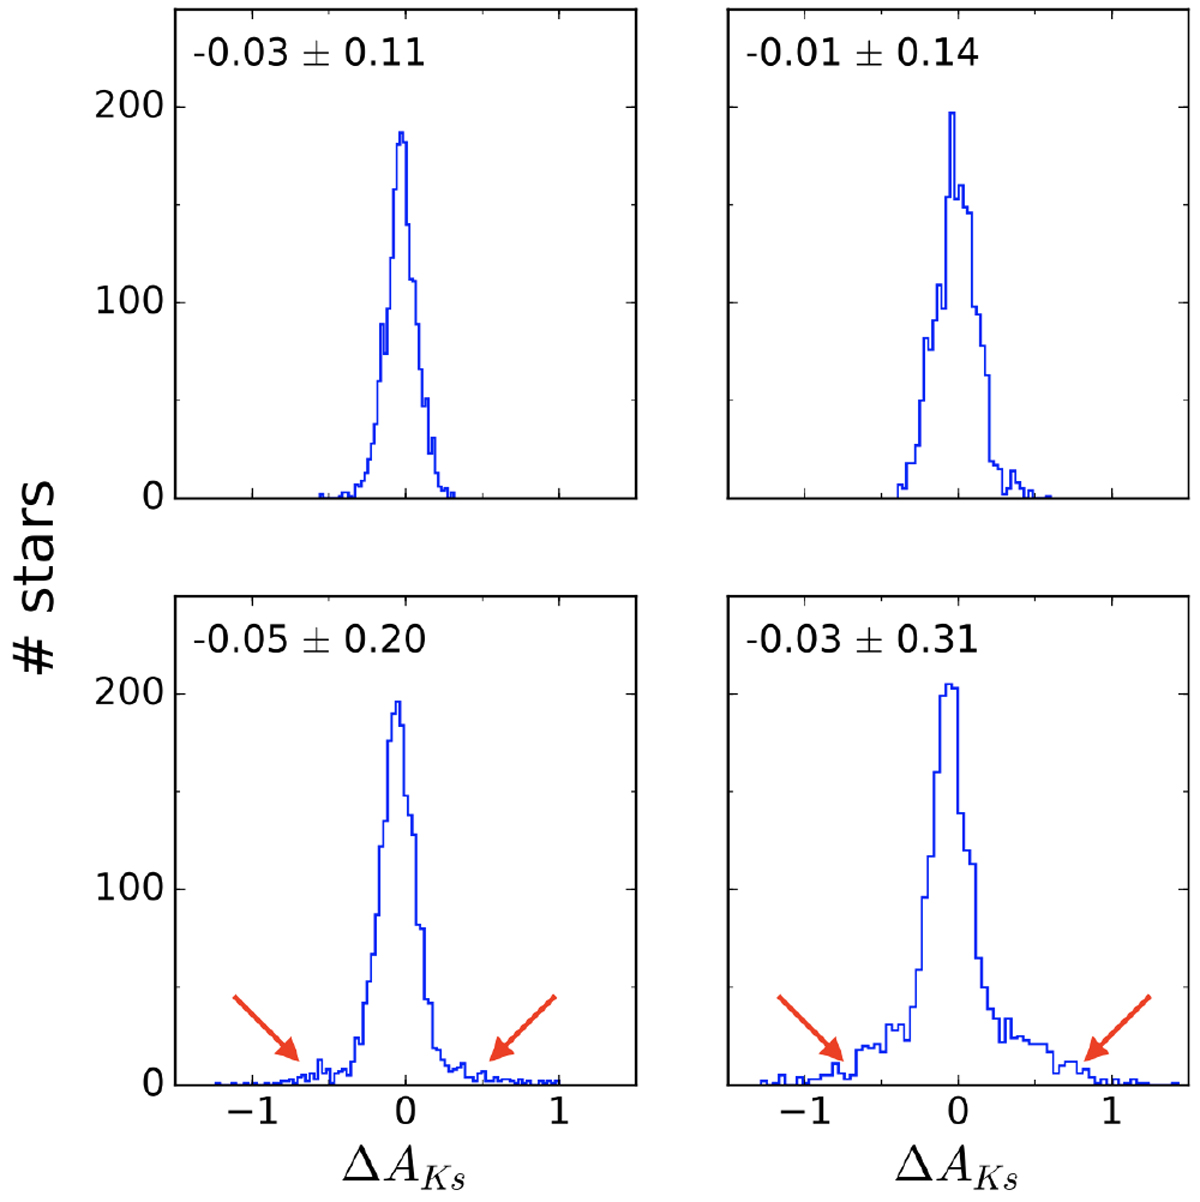
Comparison between initial extinction and recovered one using the extinction map (upper panels) and the star-by-star approach (lower panels). Left and right columns correspond to 15 % and 50 % of variable stars, respectively. The red arrows indicate the tails associated with variable stars for the star-by-star approach. The mean and the standard deviations of the distributions are indicated for each case.
Current usage metrics show cumulative count of Article Views (full-text article views including HTML views, PDF and ePub downloads, according to the available data) and Abstracts Views on Vision4Press platform.
Data correspond to usage on the plateform after 2015. The current usage metrics is available 48-96 hours after online publication and is updated daily on week days.
Initial download of the metrics may take a while.