Fig. 6
Download original image
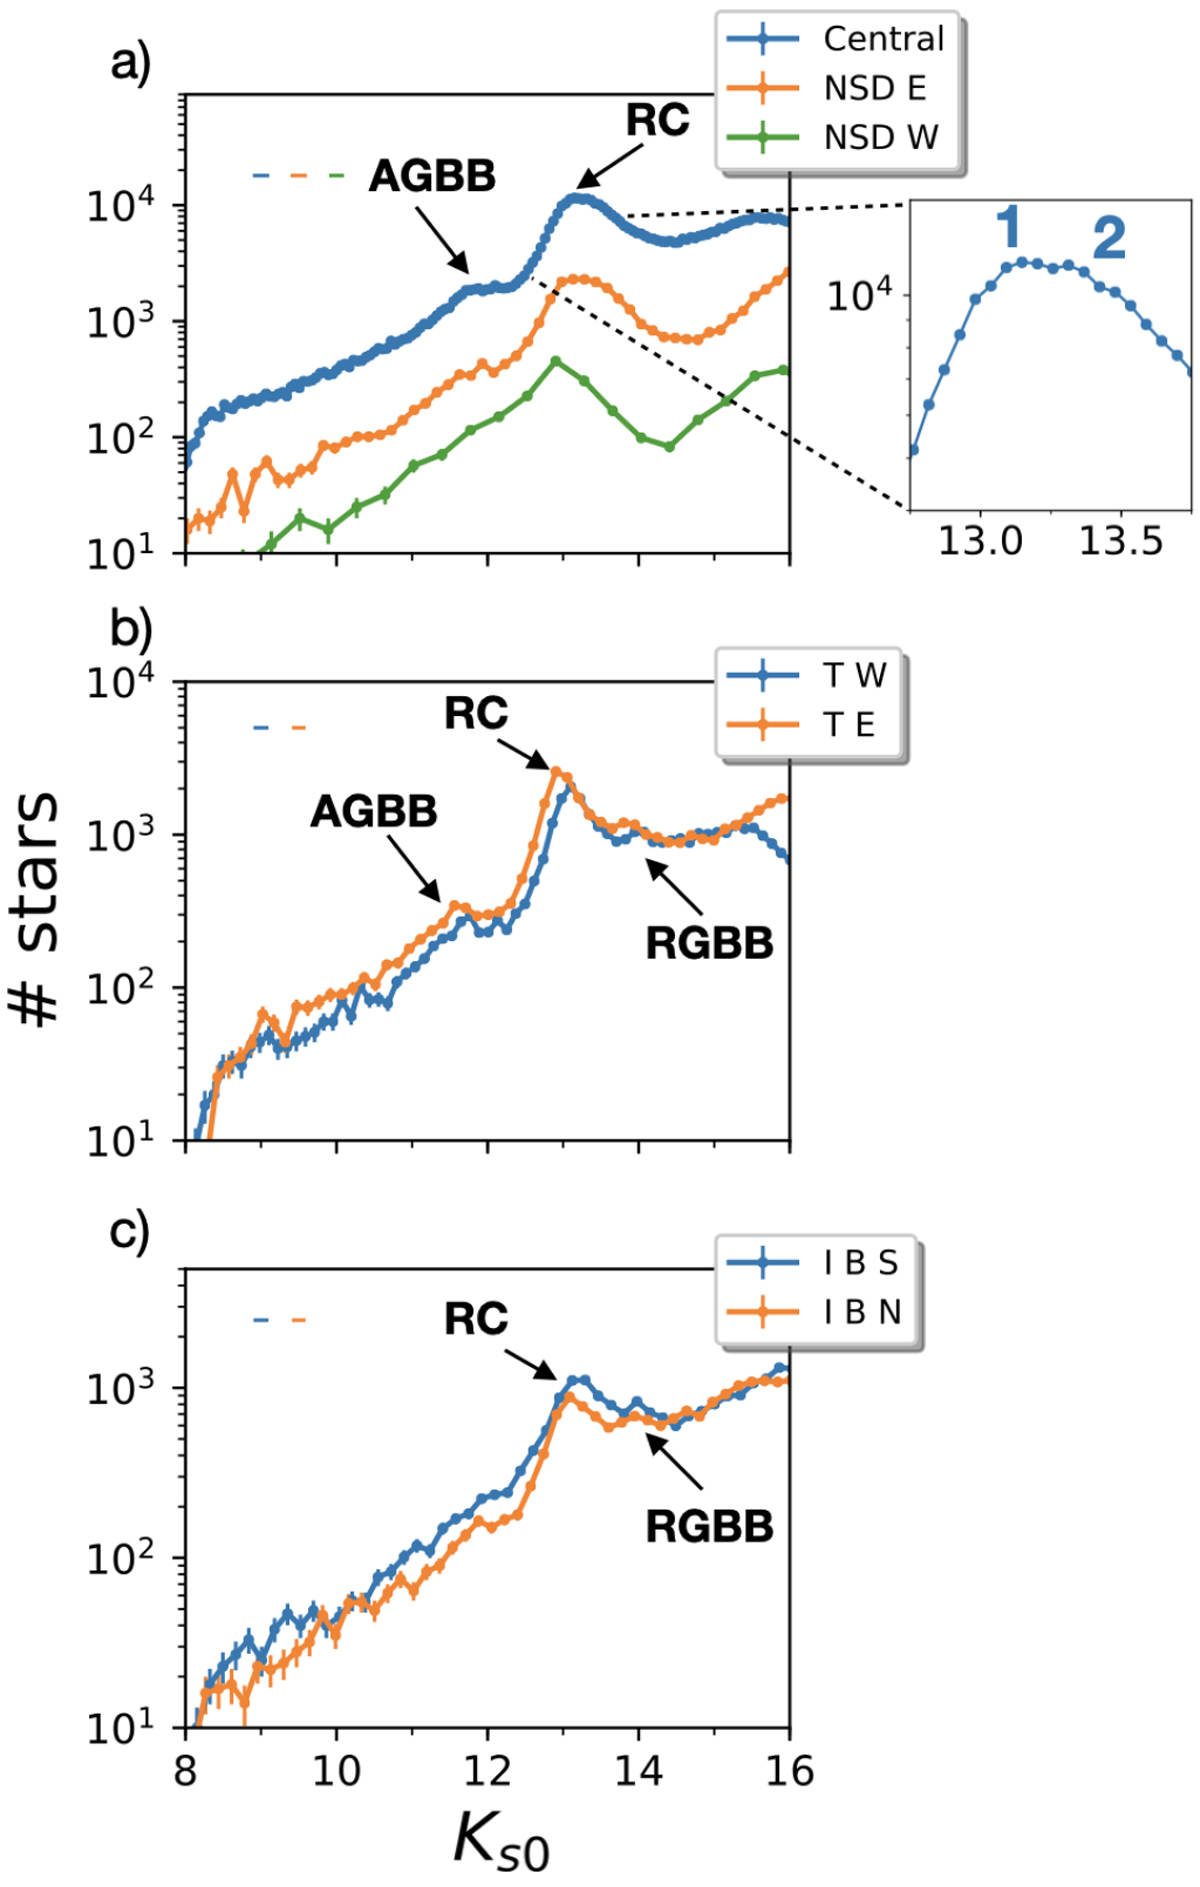
De-reddened KLFs for each of the GNS regions, as indicated in the legend. (a) NSD regions. (b) Transition regions. (c) Inner bulge regions. The uncertainties are estimated as the square root of the number of stars per bin. The bins are different for each case and were computed using the python function numpy.histogram_bin_edges (Harris et al. 2020). The RC, AGBB, and the RGBB are indicated in the panels, where the features are detected. The coloured error bars on the top of the panels indicate the systematic uncertainty due to the de-reddening process and the ZP systematics. The green KLF corresponding to the NSD W suffers from low completeness due to lower than average data quality. The zoom-in panel indicates the double RC feature associated with the Central region.
Current usage metrics show cumulative count of Article Views (full-text article views including HTML views, PDF and ePub downloads, according to the available data) and Abstracts Views on Vision4Press platform.
Data correspond to usage on the plateform after 2015. The current usage metrics is available 48-96 hours after online publication and is updated daily on week days.
Initial download of the metrics may take a while.