Fig. 5
Download original image
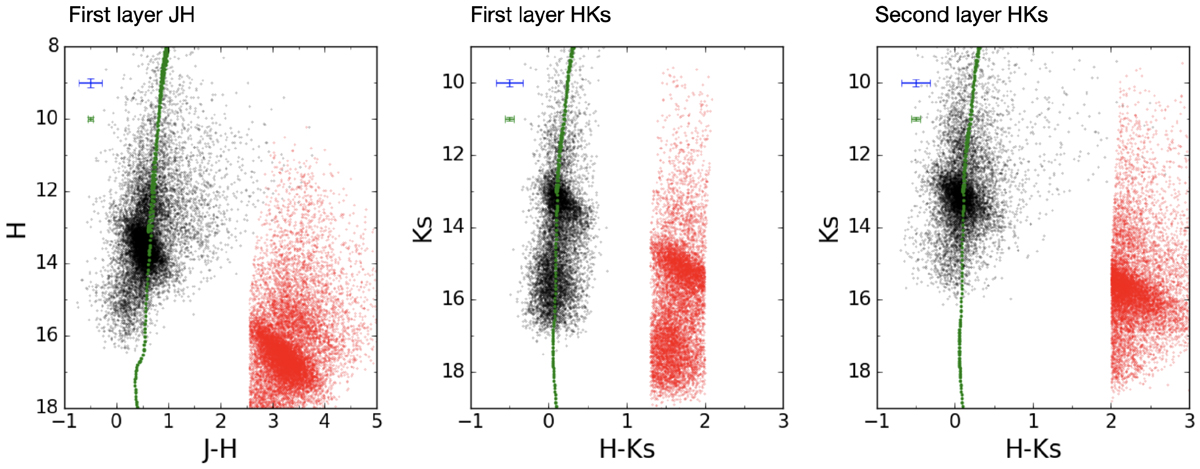
Colour-magnitude diagrams before and after the application of the extinction maps to the Central region of the GNS survey. The red and black dots correspond to the original and the de-reddened CMDs, respectively. Only a fraction of stars are plotted given the high number of sources. The labels above each panel indicate the corresponding extinction layer. The green line depicts a Parsec isochrone of ~ 10 Gyr with twice solar metallicity. The blue and green error bars indicate the systematic uncertainties of the de-reddening and the ZP, respectively.
Current usage metrics show cumulative count of Article Views (full-text article views including HTML views, PDF and ePub downloads, according to the available data) and Abstracts Views on Vision4Press platform.
Data correspond to usage on the plateform after 2015. The current usage metrics is available 48-96 hours after online publication and is updated daily on week days.
Initial download of the metrics may take a while.