Fig. 3
Download original image
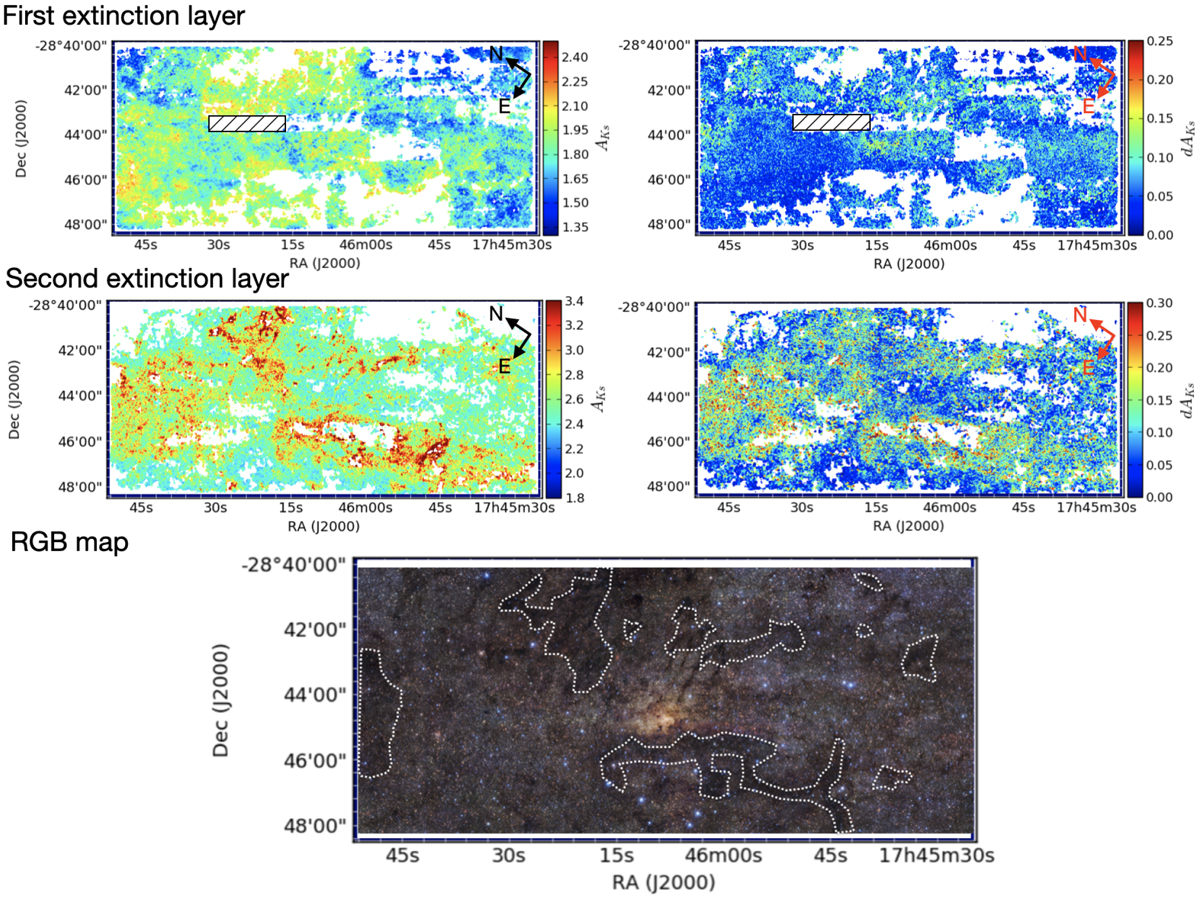
Extinction maps AKs (first column) and associated uncertainties (second column) for the Central region of the GALACTINUCLEUS survey. The scales are different for each panel according to the values of the maps and they are indicated by the colour bar. The dashed rectangles on the upper panels indicate a region where no J-band data wereavailable due to bad data quality (for further details, see Nogueras-Lara et al. 2019a). White regions indicate that there were not enough stars to assign a value. Lower panel: false colour image using JHKs bands. The dashed white lines indicate dark clouds that can be identified in the extinction map corresponding to the second layer.
Current usage metrics show cumulative count of Article Views (full-text article views including HTML views, PDF and ePub downloads, according to the available data) and Abstracts Views on Vision4Press platform.
Data correspond to usage on the plateform after 2015. The current usage metrics is available 48-96 hours after online publication and is updated daily on week days.
Initial download of the metrics may take a while.