Fig. 1
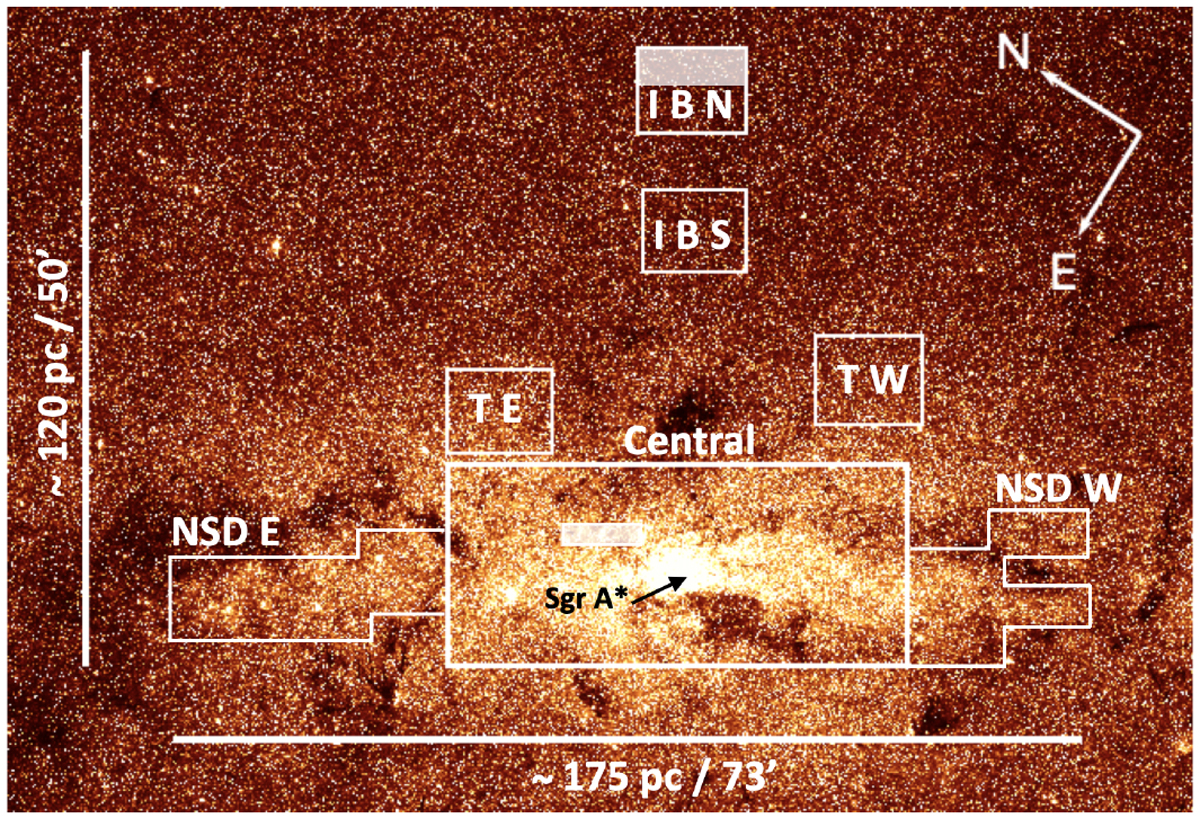
Download original image
Scheme of the GNS survey. White labels indicate the name of each of the regions of the survey: Central, NSD East (NSD E), NSD West (NSD W), transition East (T E), transition West (T W), inner bulge South (I B S), and inner bulge North (I B N). The white rectangles in the Central and I B S regions indicate a gap in the data due to bad quality (see text for details). The background image corresponds to a 3.6 μm Spitzer/IRAC image (Stolovy et al. 2006).
Current usage metrics show cumulative count of Article Views (full-text article views including HTML views, PDF and ePub downloads, according to the available data) and Abstracts Views on Vision4Press platform.
Data correspond to usage on the plateform after 2015. The current usage metrics is available 48-96 hours after online publication and is updated daily on week days.
Initial download of the metrics may take a while.