| Issue |
A&A
Volume 653, September 2021
|
|
|---|---|---|
| Article Number | A169 | |
| Number of page(s) | 6 | |
| Section | The Sun and the Heliosphere | |
| DOI | https://doi.org/10.1051/0004-6361/202140973 | |
| Published online | 29 September 2021 | |
Particle-in-cell simulation of plasma emission in solar radio bursts
1
School of Astronomy and Space Science, Nanjing University, Nanjing 210023, PR China
e-mail: lic@nju.edu.cn
2
Key Laboratory for Modern Astronomy and Astrophysics (Nanjing University), Ministry of Education, Nanjing 210023, PR China
Received:
1
April
2021
Accepted:
19
July
2021
Aims. The present study aims to shed light on our understanding of the radiation processes of solar radio bursts associated with nonthermal electron propagation in the corona and interplanetary space.
Methods. We performed 2.5-dimensional particle-in-cell (PIC) simulations to investigate the plasma emission excited by a relativistic electron beam using different pitch angles in the magnetized plasma.
Results. Langmuir waves at the fundamental and harmonic frequencies were excited via the energy dissipation of the electron beam. For the first time, the backward Langmuir waves up to the third harmonic frequencies were reproduced in the cases of large pitch angles, likely arising from the relecting and scattering of density fluctuations to the Langmuir waves during electrom beam-plasma interaction. Electromagnetic (EM) waves were generated via the mode conversion of electrostatic (ES) waves and the nonlinear wave coupling. Specifically, the harmonic EM emission comes from the coupling of forward and backward Langmuir waves, namely, L + L′ → 2H, while the higher harmonic EM emissions generally come from the coupling of the Langmuir wave and lower-order harmonic EM wave, namely, L + (n − 1)H → nH. When the electron beam exhibits a large pitch angle, another possible mechanism for the third harmonic EM emission might be the coalescence of three ES waves, namely, L + L′ + L″ → 3H.
Key words: plasmas / methods: numerical / Sun: radio radiation
© ESO 2021
1. Introduction
Since its birth in 1940s, radio astronomy has continued to develop as an effective method with which to explore the physical processes related to the high-energy particles accelerated in various astrophysical phenomena, for instance, solar and stellar eruptions, fast radio bursts, and magnetar bursts. The accelerated particles can generate radio signatures via incoherent emission, such as gyro-synchrotron radiation, or coherent emission, such as plasma emission and maser emission (Ruderman & Sutherland 1975; Goldman & Smith 1986; Sedrakian & Hayrapetyan 2015; Ni et al. 2020).
Solar radio bursts are one of the most prominent electromagnetic radiations that occur during solar eruptions. The high brightness temperatures of solar radio bursts indicate that the coherent emission associated with the nonthermal electrons is responsible for the radio emission. As an example, the type III solar radio bursts drift quickly from hundreds of MHz to several kHz, indicating the propagation of electron beams along open magnetic fields from the solar corona to the interplanetary space with velocities of 0.1–0.6c (Wild & McCready 1950; Wild et al. 1959; Alvarez & Haddock 1973; Reid et al. 2014). The radiation mechanism of solar radio bursts is widely accepted to come from the plasma emission, which is observationally supported by the presence of relativistic electron beams (Lin et al. 1973), in-situ Langmuir waves (Lin et al. 1986), and excited electromagnetic (EM) waves at fundamental and harmonic frequencies (Thejappa & MacDowall 1998). Another possible mechanism is the electron-cyclotron maser emission (Wu & Lee 1979; Melrose & Dulk 1982; Wu et al. 2002; Treumann 2006), which has been confirmed to be responsible for the auroral kilometric radiation (Ergun et al. 2000) but which is yet to be verified observationally in solar radio bursts.
The plasma emission explanation was first proposed by Ginzburg & Zhelezniakov (1958), who suggested the bump-in-tail instability driven by electron beams excites Langmuir waves. Through the nonlinear wave coupling, the Langmuir waves then generate fundamental and harmonic radio emissions (Lin et al. 1986; Huang 1998; Ganse et al. 2012). It has been noticed that the mode conversion of Langmuir waves was already proven in the laboratory (Sheng et al. 2005; Kim et al. 2007). This classical plasma emission mechanism has been further improved and developed based on analytical and numerical studies (Yoon 1997; Voitenko et al. 2003; Li & Cairns 2014).
Particle-in-cell (PIC) simulations are an effective approach for exploring the physical processes in magnetized plasmas and has been widely applied to reproduce the solar radio emission (Kasaba et al. 2001; Sakai et al. 2005; Rhee et al. 2009; Umeda 2010). In some recent studies, it has been found that the behavior of beam–plasma interaction and the conversion efficiency of exited electrostatic (ES) waves are largely dependent on the electron beam parameters (Lee et al. 2019; Henri et al. 2019). One rather important parameter that might play an important role in generating EM waves is the electron pitch angle distribution, however, it has not been fully understood in previous simulations. A 1.5-dimensional simulation was carried out by Pechhacker & Tsiklauri (2012), who suggested that the EM emission process is mainly caused by the perpendicular component of the beam injection current. However, a more recent study of Melrose et al. (2021) indicated that 1D simulations miss the scattering of Langmuir waves by turbulence in the ambient plasma, which becomes important in higher dimensions. It is therefore necessary to investigate the plasma emission excited by the electron beam with different pitch angles in a magnetized plasma, as we do in the present study by using a 2.5-dimensional, fully electromagnetic, and relativistic PIC code.
2. Simulation setup
The simulations were performed by using the well-established relativistic electromagnetic particle code EPOCH (Arber et al. 2015). The simulations were carried out in the x − y plane, where periodic boundary conditions are applied at the top and bottom boundaries, along with open boundary conditions at the left and right boundaries, where the simulation parameters are set to be zero.
The setup parameters are as follows: (1) the size of the simulation domain is 1000λDe × 300λDe, where λDe is the Debye length, and the grid size Δx = λDe; (2) the time step is Δt = 0.01 , satifying the Courant condition, where ωpe is the plasma angular frequency; (3) the background plasma consists of electrons (with number density Ne) and protons (with number density Np), described by Maxwellian distribution function; (4) to satisfy the system neutrality, we have Np = Ne + Nb, where Nb is the number density of the electron beam, and Nb/Ne = 0.05. To maintain the neutrality, the reverse motion of background electrons is applied to balance the current generated by the electron beam, and the speed of background electrons is expressed as ve = vbNb/(Ne − Nb); (5) the background magnetic field, B0 = 4 G, goes along the x direction, the background plasma temperature is Tp = Te = 106 K, the plasma β is 0.04, and the ratio of ωpe and
Ωce is 11.3, which is comparable to the case of the solar corona; (6) the mass ratio of proton to electron is taken to be the realistic value of 1836. In order to reduce the level of noise, we used 500 super-particles per cell for each particle species.
, satifying the Courant condition, where ωpe is the plasma angular frequency; (3) the background plasma consists of electrons (with number density Ne) and protons (with number density Np), described by Maxwellian distribution function; (4) to satisfy the system neutrality, we have Np = Ne + Nb, where Nb is the number density of the electron beam, and Nb/Ne = 0.05. To maintain the neutrality, the reverse motion of background electrons is applied to balance the current generated by the electron beam, and the speed of background electrons is expressed as ve = vbNb/(Ne − Nb); (5) the background magnetic field, B0 = 4 G, goes along the x direction, the background plasma temperature is Tp = Te = 106 K, the plasma β is 0.04, and the ratio of ωpe and
Ωce is 11.3, which is comparable to the case of the solar corona; (6) the mass ratio of proton to electron is taken to be the realistic value of 1836. In order to reduce the level of noise, we used 500 super-particles per cell for each particle species.
To initiate the simulations, a relativistic electron beam with a velocity of 0.3c at different pitch angles was injected into a magnetized background plasma from the left boundary (x = 0), where c is the light speed. The width of the electron beam is set to be 30λDe and the injected position is centered at y = 0.5Ly on the left boundary of the simulation domain. We ran the simulations with different pitch angles of the electron beam, that is: θ = 0°, θ = 30°, and θ = 80°, as shown in following simulation results. The larger pitch angles indicate the larger momentum and energy dissipation perpendicular to the magnetic fields.
3. Simulation results
Figure 1 shows the interaction of the electron beam and the background plasma in the x − vx phase space at times of 162 (left panel) and 389
 (right panel), respectively, when the electron beam pitch angle is θ = 0°. It can be found that the electron beam experiences strong turbulence during its propagation in the magnetized plasma. In particular, at the time of 389
 , the beam electrons and the background electrons are mixed and overlap in the velocity phase space, indicating the occurrence of significant energy dissipation from the electron beam to the background plasma.
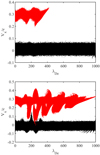 |
Fig. 1. Evolution of the electron beam and background plasma in x − vx phase space at the times of 162 |


We analyze the excited electric fields in Fig. 2. The left panel shows distribution of the field-aligned electrostatic field Ex along the x-direction Ex at the time of 290 , and the right panel depicts the distribution of the electrostatic component perpendicular to the simulation domain Ez along the x-axis. It is clearly shown the Langmuir wave packets aligned with the magnetic field are formed, which are characterized as the sinusoidal structure in the x direction and as the envelope soliton-caviton pairs in the direction perpendicular to the x-axis. We should mention that the Langmuir wave packets have previously been observed in the interplanetary space during solar type III radio bursts (Thejappa et al. 2013).
The fast Fourier transform (FFT) was applied to investigate the excited electric fields in the ω – k phase space. We first extracted the temporal series of Ex and Ez along the x direction at y = 150λDe. We then performed a 2D FFT on the x − t data matrix. The three panels in the left column of Fig. 3 display the dispersion diagrams of the electrostatic field Ex when the pitch angle of the electron beam is θ = 0°, θ = 30°, and θ = 80°, respectively. The black lines represent the electron beam mode ω = vbk, where vb is the velocity of the electron beam. The blue curves indicate the fundamental Langmuir wave whose dispersion relation can be expressed as:
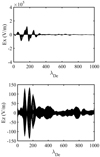 |
Fig. 2. Excited electric field components of the Langmuir wave packet at the time of 290 |

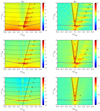 |
Fig. 3. Dispersion diagrams of electrostatic field Ex (left panels) and electromagnetic field Ez (right panels) in the cases of the following pitch angles (from top to bottom): 0°, 30°, and 80°. |
where ωpe is the plasma frequency, and ve is the thermal velocity of the background electrons. The black dashed curves indicate the harmonic Langmuir wave dispersion relations expressed as (Yoon et al. 2003):
where n is the harmonic number, λDe is the Debye length, and k0 = ωpe/vb. Figure 3 clearly illustrates that the Langmuir waves at fundamental (L) and harmonic frequencies (2L, 3L, …) are exited by the electron beam–plasma interaction, and the backward Langmuir waves (L′, L″, and L‴) are generated up to the third harmonic frequencies in the case of the pitch angle θ = 80°.
The backward Langmuir modes up to the third harmonic frequencies are, for the first time, reproduced in the present simulations. To understand how these wave modes are produced, we compare, in Fig. 4, the energy distributions of the third harmonic Langmuir modes to the density fluctuations along the x direction, in case of pitch angle of 80°. We find that the density cavities generally correspond to the maxima of wave energies (left panel) and the anti-correlation coefficiency is derived to be −0.52 (right panel). This indicates that in the reflecting and scattering of the density fluctuations to the Langmuir wave packets, as shown in Fig. 2 during the electron beam, plasma interaction probably play a key role in generating harmonic Langmuir modes and exciting EM modes (Kliem et al. 1992; Zlotnik et al. 1998).
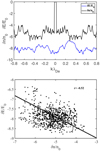 |
Fig. 4. Spatial distributions of the third harmonic Langmuir wave energies and the density fluctuations (left panel) and their anti-correlaiton (right panel) in the case of a pitch angle of 80°. |
The right panels of Fig. 3 display the dispersion diagrams of the electromagnetic field Ez. The solid and dashed curves indicate the theoretical linear fundamental and nonlinear second harmonic electromagnetic dispersion relations (Yoon 1995, 1997) that are given by:
![$$ \begin{aligned}&(\omega ^{2}-\omega _{\rm pe}^{2}-c^{2}k^{2})\left\{ (\omega ^{2}-\omega _{\rm pe}^{2}-c^{2}k^{2})\right. \nonumber \\ &\quad \left. \times \left[\omega ^{2}-\omega _{\rm pe}^{2}- \frac{c^{2}k^{2}}{16}\left(1+\frac{8k_{\Vert }^{2}}{k^{2}}\right)W_{k}^{L}\right]- c^{4}k_{\bot }^{2}k_{\Vert }^{2}W_{k}^{L}\right\} \nonumber \\ &\quad -\frac{\Omega _{\rm e}^{2}}{\omega ^{2}}\omega _{\rm pe}^{4} \left(\omega ^{2}-\omega _{\rm pe}^{2}-c^{2}k_{\bot }^{2}-\frac{9}{16}c^{2}k_{\Vert }^{2}W_{k}^{L}\right) = 0, \end{aligned} $$](/articles/aa/full_html/2021/09/aa40973-21/aa40973-21-eq11.gif)
where Ωe is the electron gyro-frequency, and  is related to the energy of the fundamental Langmuir wave that can be derived from the localized integration of the electrostatic component intensities. We find that the electrostatic components at higher harmonic frequencies are manifested at small pitch angles, namely, θ = 0° and θ = 30°. Based on the above results, the radiation processes of the harmonic electromagnetic emission can be explicated as follows. The decay of the Langmuir wave produces backward Langmuir wave and fundamental electromagnetic wave, L → L′ + F, and then the coalescence of forward and backward Langmuir waves produces the second harmonic electromagnetic emission, L + L′ → 2H. For the third harmonic electromagnetic emission, three possible processes might be involved: L + 2H → 3H (Zlotnik 1978; Cairns 1988), L + 2L → 3H (Yi et al. 2007), or L + L′ + L″ → 3H (Kliem et al. 1992) in the cases of pitch angle θ = 30° and θ = 80°.
We analyze the energy evolution of the electrostatic and electromagnetic emissions in Fig. 5. For the case of pitch angle θ = 0°, the energies of forward Langmuir waves L, 2L, and 3L continuously increase until to a saturation state at t  , after which the energies of the harmonic electromagnetic waves (2H, 3H, …) experience their impulsively increasing phases one by one. The results indicate the radiation of harmonic electromagnetic emission probably follows the Zlotnik-Cairns process (Zlotnik 1978; Cairns 1988), namely, for the second harmonic emission, it is L + L′ → 2H; and for the higher harmonic emission, it is L + (n − 1)H → nH. For cases where the pitch angle is θ = 30° and θ = 80°, the energy evolutions of the forward and backward electrostatic emission L, L′, and L″, and the third harmonic electromagnetic emission 3H, suggest that the three-wave coalescence may also count for the higher harmonic emission, that is, L + L′ + L″ → 3H (Kliem et al. 1992).
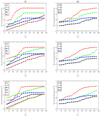 |
Fig. 5. Energy evolution of the excited electrostatic waves (left panels) and the generated electromagnetic waves (right panels), in the cases of the following pitch angles (from top to bottom): 0°, 30°, and 80°. |
The bispectral analysis can provide potential clues of the processes of nonlinear wave coupling (Kim et al. 1980). To analyze the coherence of wave modes and the nonlinear wave coupling, our plot in Fig. 6 shows the FFT- and wavelet-based bicoherence spectra of the generated electromagnetic field, Ez, in cases of the pitch angles of 0°, 30°, and 80°. It clearly shows the processes of nonlinear wave coupling, fpe + fpe → 2fpe, indicating that the second harmonic electromagnetic emission probably corresponds to the coupling of forward and backward Langmuir waves. The higher harmonics may arise from wave coupling as well, that is, fpe + 2fpe → 3fpe. In the case of small pitch angles, that is, 0° and 30°, the intensities of harmonic bicoherence spectra are relatively strong, indicating higher degrees of wave coupling. As the pitch angle increases, both the fundamental and the harmonic spectra are expanded, indicating that the increase in the pitch angle is beneficial to the release of beam-free energy and the wide excitation of waves. The analysis of the bispectral analysis at different pitch angles show that the fundamental and harmonic wave are primary, and the other harmonics are all produced by their coalescence. It is therefore clear that the electron beam-driven Langmuir waves act as a kind of “pump” to generate electromagnetic waves via the mode conversion and the nonlinear wave coupling.
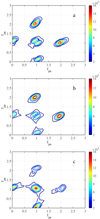 |
Fig. 6. Bicoherence spectra of electromagnetic field Ez in cases of pitch angles of 0°, 30°, and 80°. |
4. Discussions and summary
In this work, we investigate the plasma emissions excited by electron beams with different pitch angles in a magnetized plasma by using a 2.5-dimensional, fully electromagnetic, and relativistic PIC code. Langmuir waves at fundamental and harmonic frequencies are excited via the energy dissipation of the electron beam. The backward Langmuir waves up to the third harmonic frequencies are reproduced in cases of large pitch angles, likely arising from the reflecting and scattering of density fluctuations to the Langmuir waves during electrom beam and plasma interactions (Kliem et al. 1992; Zlotnik et al. 1998). Electromagnetic waves are generated via the mode conversion of electrostatic waves and the nonlinear wave coupling, which is in good agreement with the theoretical electromagnetic dispersion relations (Yoon 1995, 1997). The simulations can help improve the understanding of the radiation processes of solar radio bursts that are associated with nonthermal electron propagation in the solar corona and interplanetary space.
Our numerical results indicate the following possible radiation processes of the radio emission: (1) The fundamental electromagnetic emission probably results from the scattering of Langmuir wave and thermal ions, namely, L + i → F, due to the fact that hot plasma is adopted in the simulations. Another possible explanation comes from the decay of Langmuir waves, namely, L → S + F, where S represents the ion acoustic waves (Umeda 2010), as we may notice from the left panels of Fig. 3, where we show some possible signatures of the low-frequency ion acoustic waves. (2) The second harmonic electromagnetic emission is generated first via the decay of Langmuir waves, namely, L → L′ + F, and then via the coupling of forward and backward Langmuir waves, namely, L + L′ → 2H. (3) The higher harmonic electromagnetic emission probably results from the coupling of Langmuir waves and harmonic electromagnetic waves, namely, L + (n − 1)H → nH (Zlotnik 1978; Cairns 1988). There is another possibility that cannot be excluded, namely, the coalescence of electrostatic waves for the third harmonic electromagnetic emission, L + L′ + L″ → 3H (Kliem et al. 1992), especially for the cases of large electron pitch angles.
Acknowledgments
We would like to thank the anonymous referee whose constructive comments and suggestions greatly improve this study. This work is supported by the National Key Research and Development Program of China (2020YFC2201200), the National Natural Science Foundation of China (grants 11673012 and 11961131002), and the “Integration of Space- and Ground-based Instruments” project of the China National Space Administration.
References
- Alvarez, H., & Haddock, F. T. 1973, Sol. Phys., 30, 175 [NASA ADS] [CrossRef] [Google Scholar]
- Arber, T. D., Bennett, K., Brady, C. S., et al. 2015, Plasma Phys. Controlled Fusion, 57, 113001 [NASA ADS] [CrossRef] [Google Scholar]
- Cairns, I. H. 1988, J. Geophys. Res., 93, 858 [NASA ADS] [CrossRef] [Google Scholar]
- Ergun, R. E., Carlson, C. W., McFadden, J. P., et al. 2000, ApJ, 538, 456 [NASA ADS] [CrossRef] [Google Scholar]
- Ganse, U., Kilian, P., Spanier, F., & Vainio, R. 2012, ApJ, 751, 145 [NASA ADS] [CrossRef] [Google Scholar]
- Ginzburg, V. L., & Zhelezniakov, V. V. 1958, Sov. Astron., 2, 653 [Google Scholar]
- Goldman, M. V., & Smith, D. F. 1986, in Physics of the Sun (Dordrecht: D. Reidel Publishing Co.), 2, 325 [NASA ADS] [Google Scholar]
- Henri, P., Sgattoni, A., Briand, C., Amiranoff, F., & Riconda, C. 2019, J. Geophys. Res. (Space Phys.), 124, 1475 [NASA ADS] [CrossRef] [Google Scholar]
- Huang, G. 1998, ApJ, 498, 877 [NASA ADS] [CrossRef] [Google Scholar]
- Kasaba, Y., Matsumoto, H., & Omura, Y. 2001, J. Geophys. Res., 106, 18693 [NASA ADS] [CrossRef] [Google Scholar]
- Kim, Y. C., Beall, J. M., Powers, E. J., & Miksad, R. W. 1980, Phys. Fluids, 23, 258 [NASA ADS] [CrossRef] [Google Scholar]
- Kim, E.-H., Cairns, I. H., & Robinson, P. A. 2007, Phys. Rev. Lett., 99, 015003 [CrossRef] [Google Scholar]
- Kliem, B., Krueger, A., & Treumann, R. A. 1992, Sol. Phys., 140, 149 [CrossRef] [Google Scholar]
- Lee, S.-Y., Ziebell, L. F., Yoon, P. H., Gaelzer, R., & Lee, E. S. 2019, ApJ, 871, 74 [NASA ADS] [CrossRef] [Google Scholar]
- Li, B., & Cairns, I. H. 2014, Sol. Phys., 289, 951 [NASA ADS] [CrossRef] [Google Scholar]
- Lin, R. P., Evans, L. G., & Fainberg, J. 1973, Astrophys. Lett., 14, 191 [NASA ADS] [Google Scholar]
- Lin, R. P., Levedahl, W. K., Lotko, W., Gurnett, D. A., & Scarf, F. L. 1986, ApJ, 308, 954 [NASA ADS] [CrossRef] [Google Scholar]
- Melrose, D. B., & Dulk, G. A. 1982, ApJ, 259, 844 [NASA ADS] [CrossRef] [Google Scholar]
- Melrose, D. B., Harding, J., & Cairns, I. H. 2021, Sol. Phys., 296, 42 [NASA ADS] [CrossRef] [Google Scholar]
- Ni, S., Chen, Y., Li, C., et al. 2020, ApJ, 891, L25 [NASA ADS] [CrossRef] [Google Scholar]
- Pechhacker, R., & Tsiklauri, D. 2012, Phys. Plasmas, 19, 112903 [NASA ADS] [CrossRef] [Google Scholar]
- Reid, H. A. S., Vilmer, N., & Kontar, E. P. 2014, A&A, 567, A85 [NASA ADS] [CrossRef] [EDP Sciences] [Google Scholar]
- Rhee, T., Ryu, C.-M., Woo, M., et al. 2009, ApJ, 694, 618 [NASA ADS] [CrossRef] [Google Scholar]
- Ruderman, M. A., & Sutherland, P. G. 1975, ApJ, 196, 51 [NASA ADS] [CrossRef] [EDP Sciences] [Google Scholar]
- Sakai, J. I., Kitamoto, T., & Saito, S. 2005, ApJ, 622, L157 [NASA ADS] [CrossRef] [Google Scholar]
- Sedrakian, D. M., & Hayrapetyan, M. V. 2015, Astrophysics, 58, 131 [NASA ADS] [CrossRef] [Google Scholar]
- Sheng, Z.-M., Mima, K., Zhang, J., & Sanuki, H. 2005, Phys. Rev. Lett., 94, 095003 [NASA ADS] [CrossRef] [Google Scholar]
- Thejappa, G., & MacDowall, R. J. 1998, ApJ, 498, 465 [NASA ADS] [CrossRef] [Google Scholar]
- Thejappa, G., MacDowall, R. J., & Bergamo, M. 2013, J. Geophys. Res. (Space Phys.), 118, 4039 [NASA ADS] [CrossRef] [Google Scholar]
- Treumann, R. A. 2006, A&ARv, 13, 229 [NASA ADS] [CrossRef] [Google Scholar]
- Umeda, T. 2010, J. Geophys. Res. (Space Phys.), 115, A01204 [NASA ADS] [Google Scholar]
- Voitenko, Y., Goossens, M., Sirenko, O., & Chian, A. C. L. 2003, A&A, 409, 331 [NASA ADS] [CrossRef] [EDP Sciences] [Google Scholar]
- Wild, J. P., & McCready, L. L. 1950, Aust. J. Sci. Res. A Phys. Sci., 3, 387 [Google Scholar]
- Wild, J. P., Sheridan, K. V., & Neylan, A. A. 1959, Aust. J. Phys., 12, 369 [NASA ADS] [CrossRef] [Google Scholar]
- Wu, C. S., & Lee, L. C. 1979, ApJ, 230, 621 [NASA ADS] [CrossRef] [Google Scholar]
- Wu, C. S., Wang, C. B., Yoon, P. H., Zheng, H. N., & Wang, S. 2002, ApJ, 575, 1094 [NASA ADS] [CrossRef] [Google Scholar]
- Yi, S., Yoon, P. H., & Ryu, C.-M. 2007, Phys. Plasmas, 14, 013301 [NASA ADS] [CrossRef] [Google Scholar]
- Yoon, P. H. 1995, Phys. Plasmas, 2, 537 [NASA ADS] [CrossRef] [Google Scholar]
- Yoon, P. H. 1997, Phys. Plasmas, 4, 3863 [NASA ADS] [CrossRef] [Google Scholar]
- Yoon, P. H., Gaelzer, R., Umeda, T., Omura, Y., & Matsumoto, H. 2003, Phys. Plasmas, 10, 364 [NASA ADS] [CrossRef] [Google Scholar]
- Zlotnik, E. I. 1978, Sov. Astron., 22, 228 [NASA ADS] [Google Scholar]
- Zlotnik, E. Y., Klassen, A., Klein, K. L., Aurass, H., & Mann, G. 1998, A&A, 331, 1087 [NASA ADS] [Google Scholar]
All Figures
|
Fig. 1. Evolution of the electron beam and background plasma in x − vx phase space at the times of 162 |
| In the text | |
|
Fig. 2. Excited electric field components of the Langmuir wave packet at the time of 290 |
| In the text | |
|
Fig. 3. Dispersion diagrams of electrostatic field Ex (left panels) and electromagnetic field Ez (right panels) in the cases of the following pitch angles (from top to bottom): 0°, 30°, and 80°. |
| In the text | |
|
Fig. 4. Spatial distributions of the third harmonic Langmuir wave energies and the density fluctuations (left panel) and their anti-correlaiton (right panel) in the case of a pitch angle of 80°. |
| In the text | |
|
Fig. 5. Energy evolution of the excited electrostatic waves (left panels) and the generated electromagnetic waves (right panels), in the cases of the following pitch angles (from top to bottom): 0°, 30°, and 80°. |
| In the text | |
|
Fig. 6. Bicoherence spectra of electromagnetic field Ez in cases of pitch angles of 0°, 30°, and 80°. |
| In the text | |
Current usage metrics show cumulative count of Article Views (full-text article views including HTML views, PDF and ePub downloads, according to the available data) and Abstracts Views on Vision4Press platform.
Data correspond to usage on the plateform after 2015. The current usage metrics is available 48-96 hours after online publication and is updated daily on week days.
Initial download of the metrics may take a while.