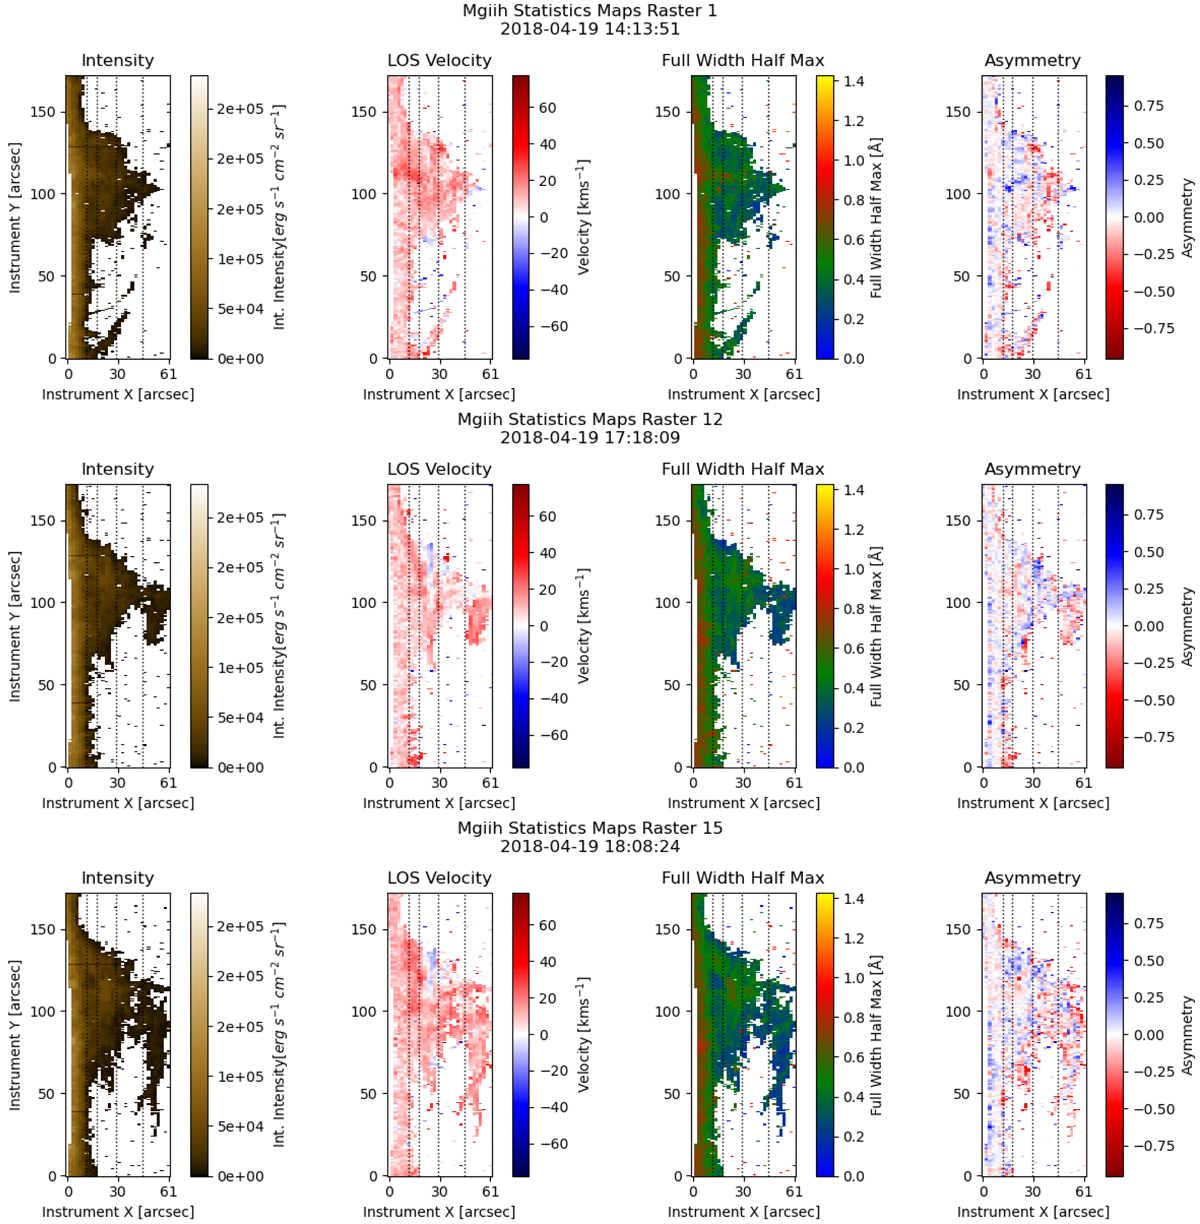
Fig. 10.
Download original image
Mg II h statistics maps of the three main stages of the prominence observation calculated via the quantile method. In the first raster we see a rather static structure. In raster 12, the rise that eventually leads into a flow begins to form. In raster 15, the flow seen in raster 12 is beginning. The times associated with these plots are the time at the beginning of the associated raster. The dashed lines represent the slit positions in Fig. 6. Mg II k produces similar plots and these can be seen in Fig. A.1. An animated version of this figure is available online.
Current usage metrics show cumulative count of Article Views (full-text article views including HTML views, PDF and ePub downloads, according to the available data) and Abstracts Views on Vision4Press platform.
Data correspond to usage on the plateform after 2015. The current usage metrics is available 48-96 hours after online publication and is updated daily on week days.
Initial download of the metrics may take a while.