Fig. 8.
Download original image
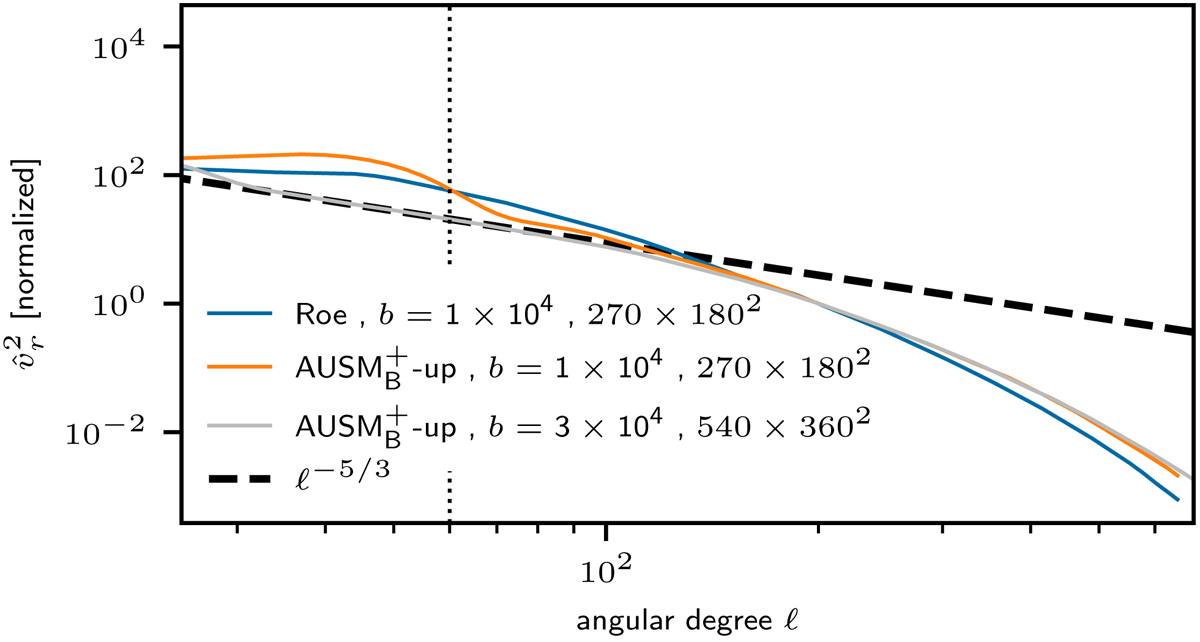
Spectra of the radial kinetic energy component. The blue and orange line correspond to simulations with the Roe and ![]() schemes of a reduced domain that only contains a fraction of the convection zone. The gray line shows the spectrum for a simulation of the full domain with the
schemes of a reduced domain that only contains a fraction of the convection zone. The gray line shows the spectrum for a simulation of the full domain with the ![]() solver, the same grid spacing, but a different energy boosting. The amplitudes have been normalized such that they are unity at ℓ = 200 to ease the comparison. The dashed line marks the Kolmogorov-scaling according to Eq. (13). The vertical dotted line at ℓmax = 60 denotes the spectral width of the applied window functions for the runs with 270 × 1802 cells. For ℓ ≤ ℓmax, their spectra are dominated by the convolution with the window function and do not reflect real data. The horizontal axis is truncated at the spectral width of the window function for the 540 × 3602 run which corresponds to ℓmax = 25.
solver, the same grid spacing, but a different energy boosting. The amplitudes have been normalized such that they are unity at ℓ = 200 to ease the comparison. The dashed line marks the Kolmogorov-scaling according to Eq. (13). The vertical dotted line at ℓmax = 60 denotes the spectral width of the applied window functions for the runs with 270 × 1802 cells. For ℓ ≤ ℓmax, their spectra are dominated by the convolution with the window function and do not reflect real data. The horizontal axis is truncated at the spectral width of the window function for the 540 × 3602 run which corresponds to ℓmax = 25.
Current usage metrics show cumulative count of Article Views (full-text article views including HTML views, PDF and ePub downloads, according to the available data) and Abstracts Views on Vision4Press platform.
Data correspond to usage on the plateform after 2015. The current usage metrics is available 48-96 hours after online publication and is updated daily on week days.
Initial download of the metrics may take a while.