Fig. 6.
Download original image
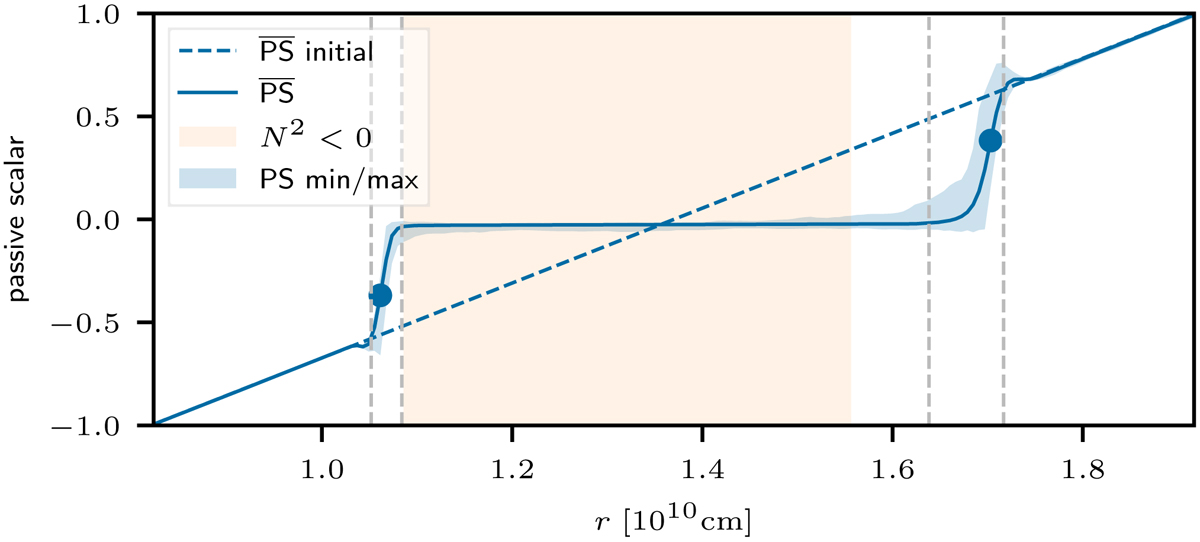
Horizontal mean of the advected passive scalar for a simulation with a resolution of 180 × 902. The initial distribution of the scalar is shown as dashed line, the solid line represents the time-averaged profile for t ∈ [t(Nτconv = 9.9),t(Nτconv = 10.1)]. The blue shaded area corresponds to the minimal and maximal value of the passive scalar at the corresponding radius for the latest considered snapshot. The radii at which the absolute value of the radial derivative is largest are indicated by dots. They define the position of the top and bottom boundaries. The shaded orange area marks the convective region according to the stability criterion N2 < 0. Vertical dashed lines denote the respective boundary widths which are defined in Sect. 5.6.
Current usage metrics show cumulative count of Article Views (full-text article views including HTML views, PDF and ePub downloads, according to the available data) and Abstracts Views on Vision4Press platform.
Data correspond to usage on the plateform after 2015. The current usage metrics is available 48-96 hours after online publication and is updated daily on week days.
Initial download of the metrics may take a while.