Fig. 5.
Download original image
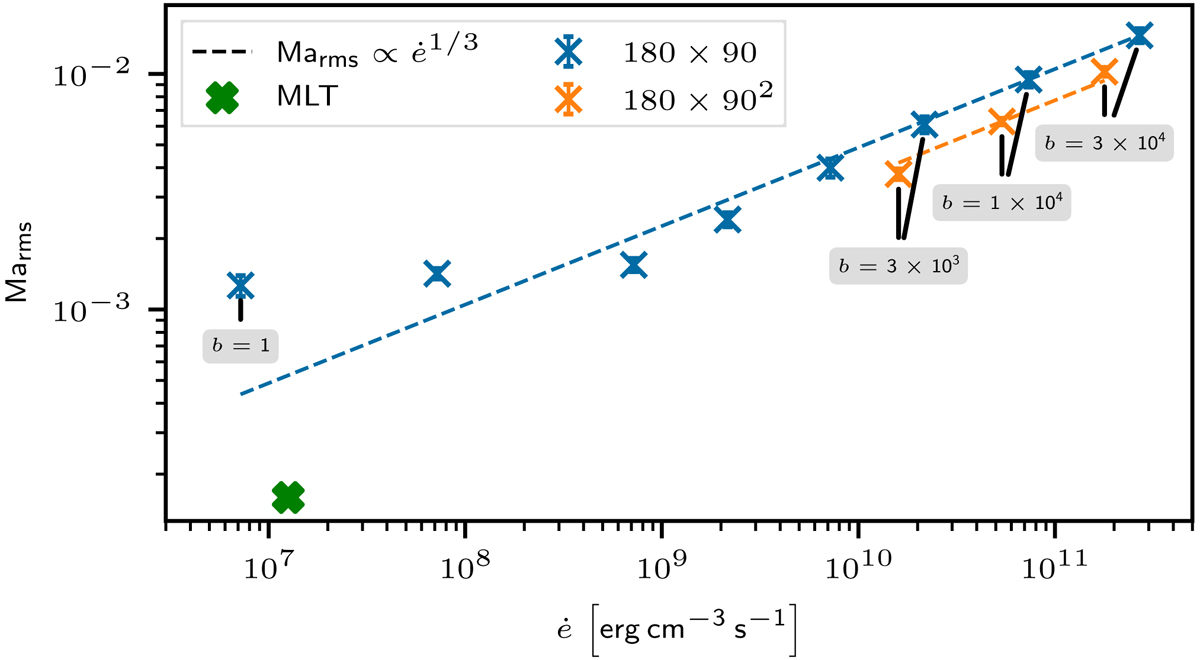
Measured rms Mach number as function of the input energy rate ė in 2D (blue) and 3D simulations (orange). Vertical error bars correspond to the standard deviation of the average over the time frame of ΔNτconv = 10. The dashed lines reflect the scaling law in Eq. (10). Numbers given in the boxes correspond to energy boosting factors for the lowest and the three highest boostings. The green cross marks the Mach number of Ma ≈ 1.6 × 10⁻⁴ as predicted by MLT at the nominal energy generation rate in the original MESA model.
Current usage metrics show cumulative count of Article Views (full-text article views including HTML views, PDF and ePub downloads, according to the available data) and Abstracts Views on Vision4Press platform.
Data correspond to usage on the plateform after 2015. The current usage metrics is available 48-96 hours after online publication and is updated daily on week days.
Initial download of the metrics may take a while.