Fig. B.2.
Download original image
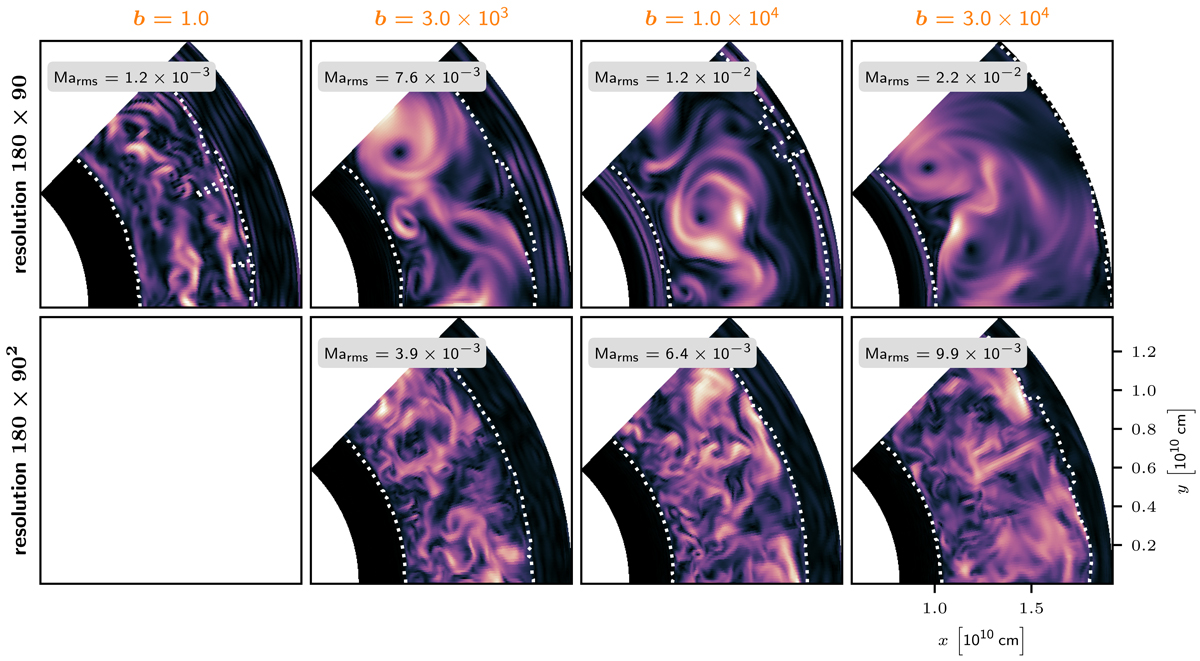
Flow patterns for 2D (upper row) and 3D (lower row) simulations at different boosting strengths. The Mach number is color-coded; the color-scale is adjusted to every subplot individually. Plots for the 3D simulations show the equatorial plane. White dashed lines denote the detected boundaries as described in Section 5.1. For all simulations, the AUSM+-up solver was used. No 3D data is available for b = 1.0.
Current usage metrics show cumulative count of Article Views (full-text article views including HTML views, PDF and ePub downloads, according to the available data) and Abstracts Views on Vision4Press platform.
Data correspond to usage on the plateform after 2015. The current usage metrics is available 48-96 hours after online publication and is updated daily on week days.
Initial download of the metrics may take a while.