Fig. 23.

Download original image
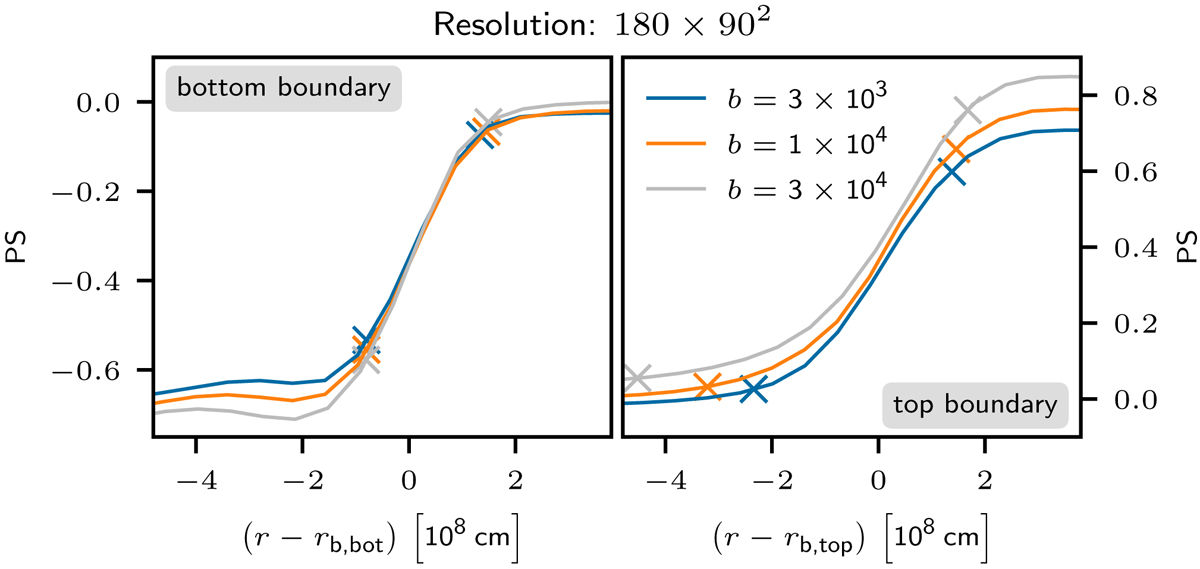
Profiles of the advected passive scalar for different energy input boostings. All simulations use the AUSM+-up solver. The profiles are taken at t(Nτconv = 15), crosses denote the beginning and end of the boundary transition zone, as defined in the text. Following the approach of C+17, the profiles are shifted by the radial position of the bottom (rb, bot) and top (rb, top) boundary, respectively. The different amplitudes of the passive scalar below the bottom and above the top boundary are due to the fact that the initial profile is linear, see Fig. 6. Larger boosting leads to faster entrainment and the top boundary will have already moved toward larger radii, that is larger values of the passive scalar, for the snapshot shown in Fig. 23.
Current usage metrics show cumulative count of Article Views (full-text article views including HTML views, PDF and ePub downloads, according to the available data) and Abstracts Views on Vision4Press platform.
Data correspond to usage on the plateform after 2015. The current usage metrics is available 48-96 hours after online publication and is updated daily on week days.
Initial download of the metrics may take a while.


