Fig. 21.
Download original image
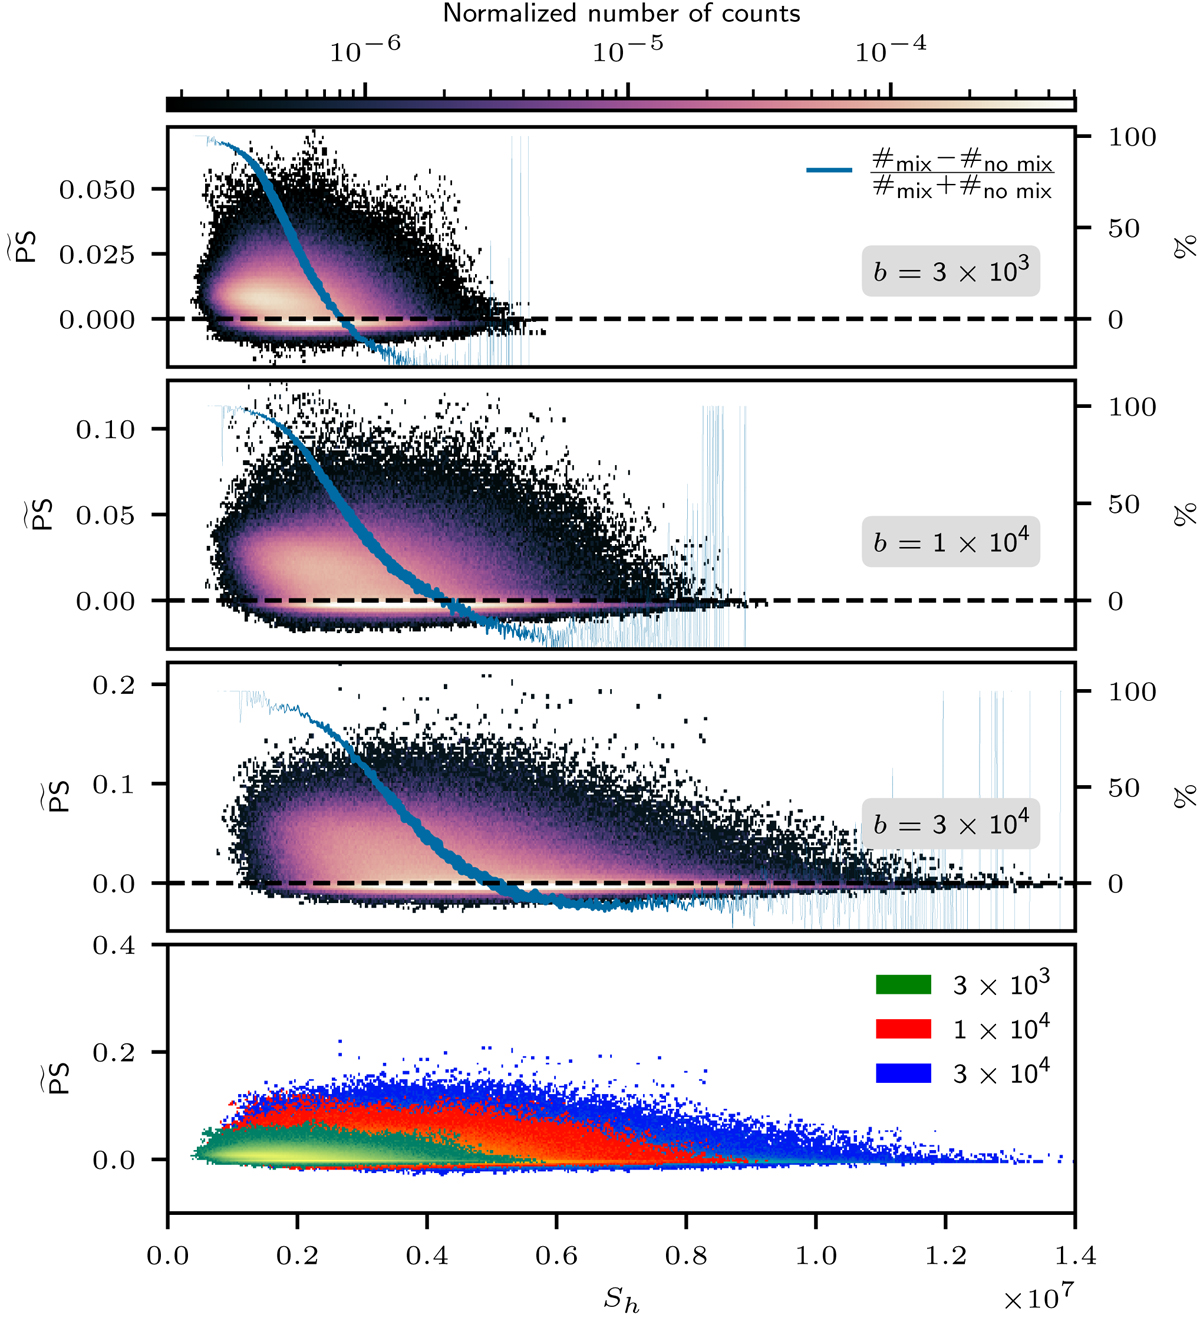
Histogram of fluctuations of the passive scalar ![]() (Eq. (23)) as a function of shear strength for simulations with the AUSM+-up solver and a resolution of 180 × 902. The boosting strength increases from top to bottom. The lowest panel combines all three histograms to ease the direct comparison. The values of fluctuations and shear strengths are extracted in a narrow band below the top boundary of the convection zone, as illustrated in Fig. 20. The histograms are normalized by the total number of counts, that is the number of horizontal grid cells multiplied by the number of considered grid files. The blue lines indicate the relative excess of mixing events (positive passive scalar fluctuation) or “no mixing” events (negative passive scalar fluctuation) relative to the total number of events for the respective shear strength. The width of the lines is scaled linearly with the relative contribution of the counts at the respective shear strength to the global number of counts. A thick line therefore indicates a significant contribution while the thin lines at very small and large shear strengths indicate a negligible contribution to the total amount of events. The considered time frame is t ∈ [t(Nτconv = 17.5), t(Nτconv = 25)].
(Eq. (23)) as a function of shear strength for simulations with the AUSM+-up solver and a resolution of 180 × 902. The boosting strength increases from top to bottom. The lowest panel combines all three histograms to ease the direct comparison. The values of fluctuations and shear strengths are extracted in a narrow band below the top boundary of the convection zone, as illustrated in Fig. 20. The histograms are normalized by the total number of counts, that is the number of horizontal grid cells multiplied by the number of considered grid files. The blue lines indicate the relative excess of mixing events (positive passive scalar fluctuation) or “no mixing” events (negative passive scalar fluctuation) relative to the total number of events for the respective shear strength. The width of the lines is scaled linearly with the relative contribution of the counts at the respective shear strength to the global number of counts. A thick line therefore indicates a significant contribution while the thin lines at very small and large shear strengths indicate a negligible contribution to the total amount of events. The considered time frame is t ∈ [t(Nτconv = 17.5), t(Nτconv = 25)].
Current usage metrics show cumulative count of Article Views (full-text article views including HTML views, PDF and ePub downloads, according to the available data) and Abstracts Views on Vision4Press platform.
Data correspond to usage on the plateform after 2015. The current usage metrics is available 48-96 hours after online publication and is updated daily on week days.
Initial download of the metrics may take a while.