Fig. 20.
Download original image
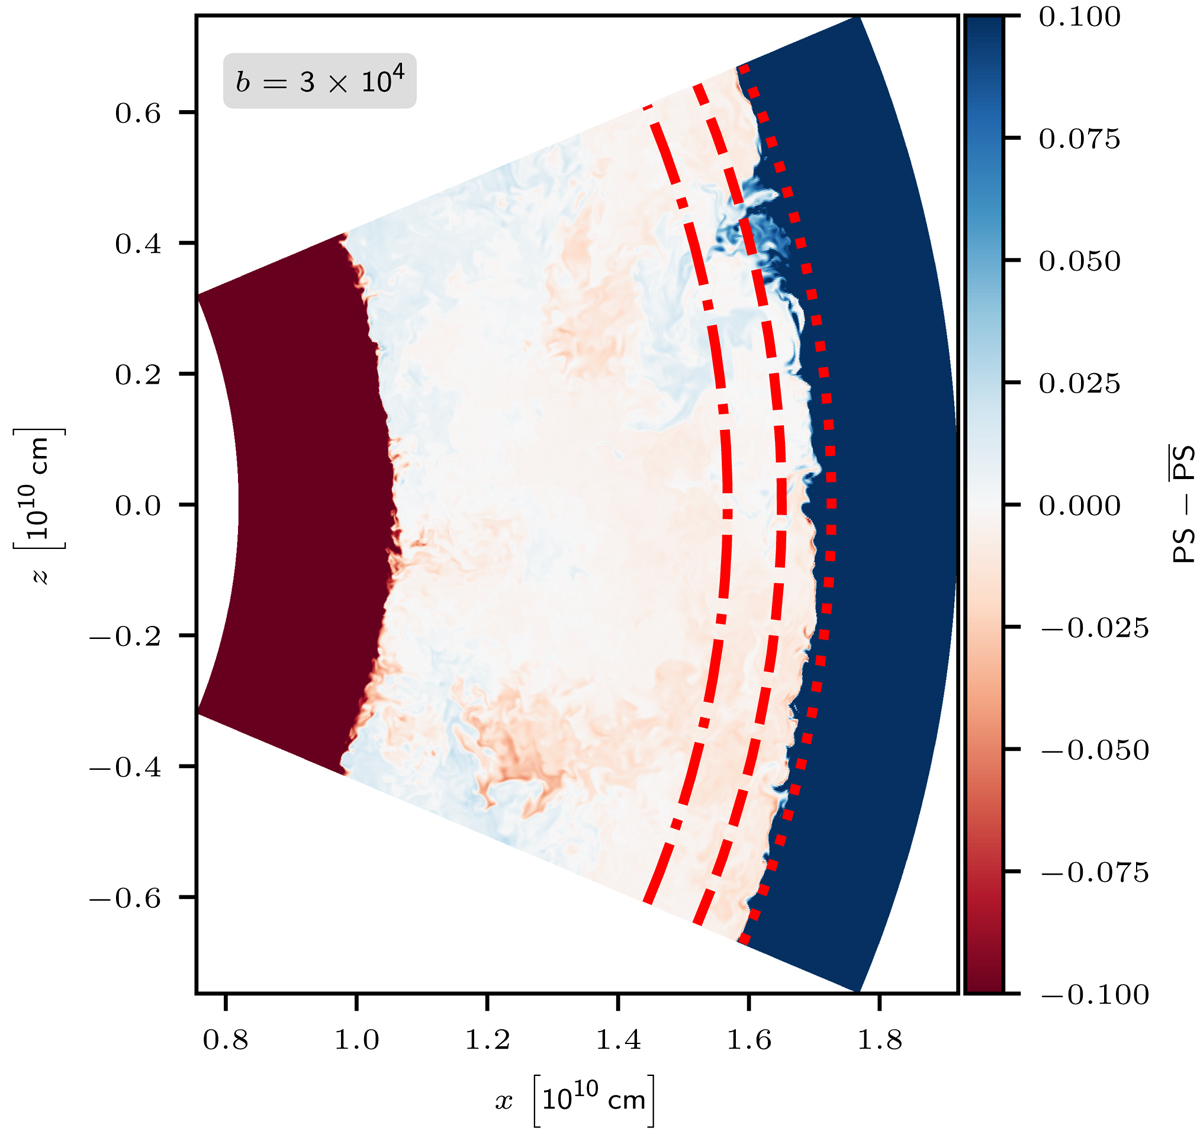
Fluctuations of the passive scalar PS from its mean value ![]() for a snapshot of the 3D simulation at a resolution of 810 × 5402 cells and a boosting factor of 3 × 10⁴. The mean
for a snapshot of the 3D simulation at a resolution of 810 × 5402 cells and a boosting factor of 3 × 10⁴. The mean ![]() is taken over the inner third of the convection zone. The dashed-dotted line corresponds to rPS, the dashed line to rP and the dotted line to rS. Their meanings are explained in the main text.
is taken over the inner third of the convection zone. The dashed-dotted line corresponds to rPS, the dashed line to rP and the dotted line to rS. Their meanings are explained in the main text.
Current usage metrics show cumulative count of Article Views (full-text article views including HTML views, PDF and ePub downloads, according to the available data) and Abstracts Views on Vision4Press platform.
Data correspond to usage on the plateform after 2015. The current usage metrics is available 48-96 hours after online publication and is updated daily on week days.
Initial download of the metrics may take a while.