Free Access
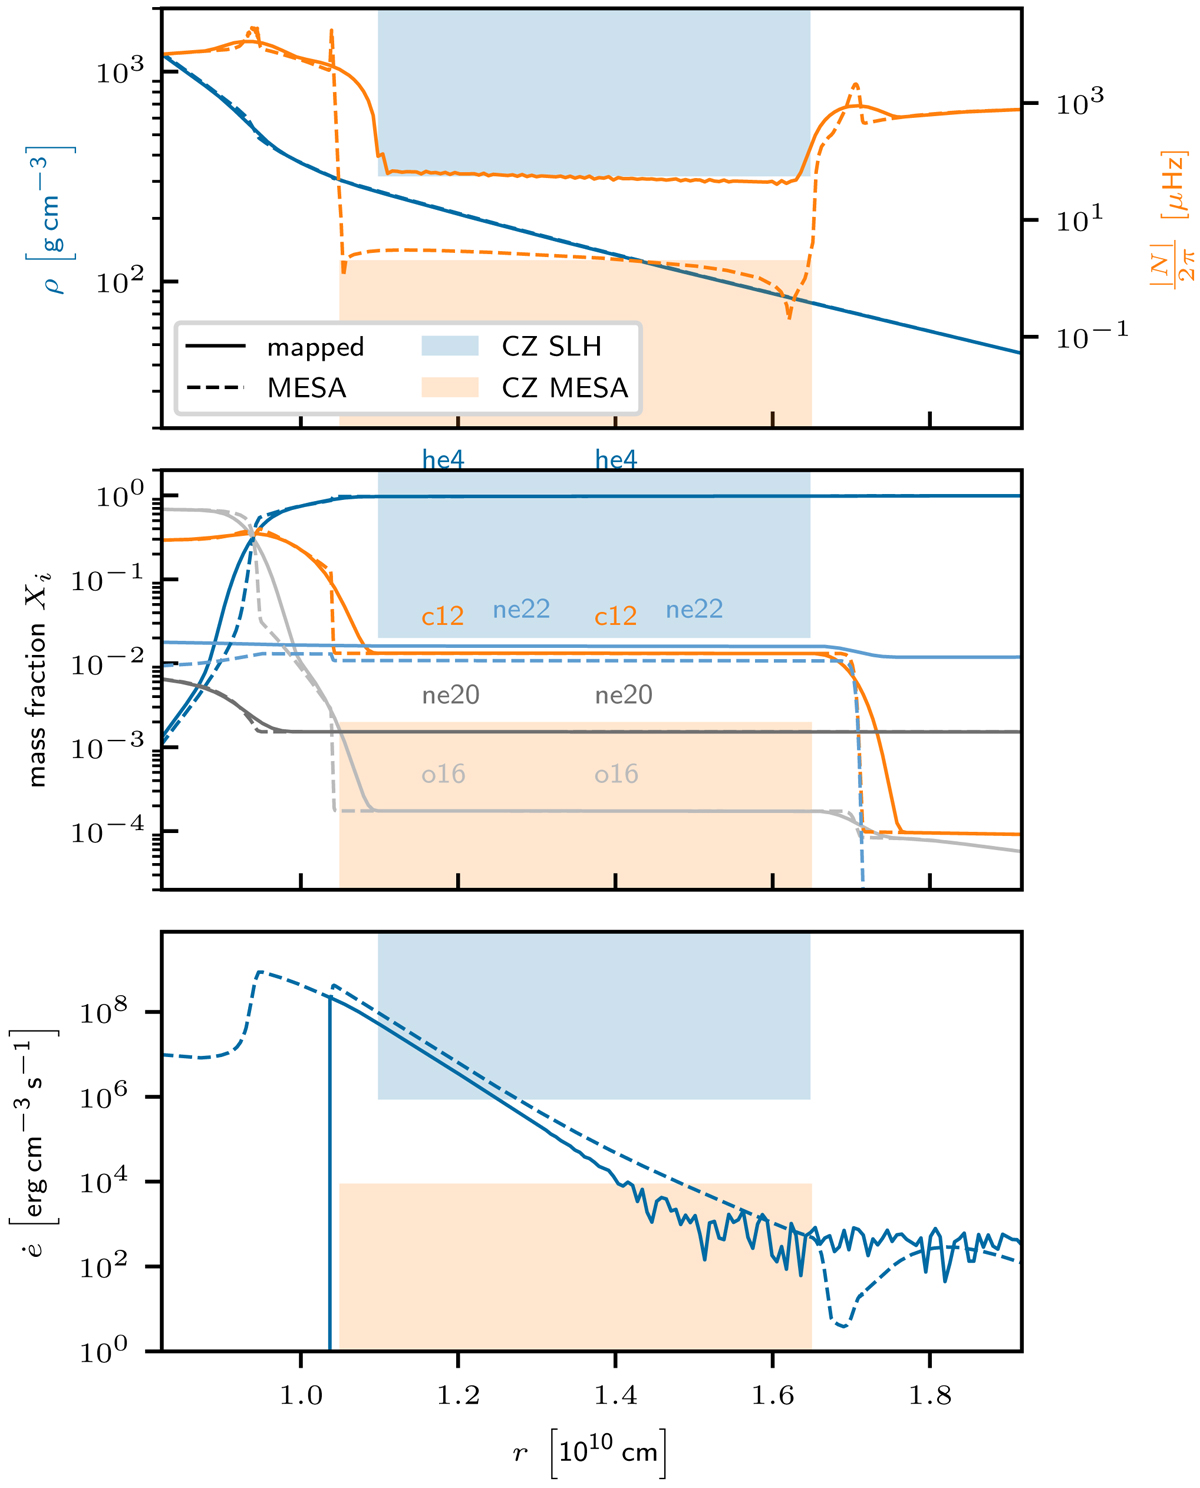
Fig. 2.
Download original image
Initial profiles for the underlying 1D MESA model (dashed) and the mapped SLH model (solid lines). The shaded areas mark the convection zone for mapped profiles (blue) and MESA profiles (orange). The oscillatory behavior of the energy generation is a numerical artifact at negligible amplitudes.
Current usage metrics show cumulative count of Article Views (full-text article views including HTML views, PDF and ePub downloads, according to the available data) and Abstracts Views on Vision4Press platform.
Data correspond to usage on the plateform after 2015. The current usage metrics is available 48-96 hours after online publication and is updated daily on week days.
Initial download of the metrics may take a while.