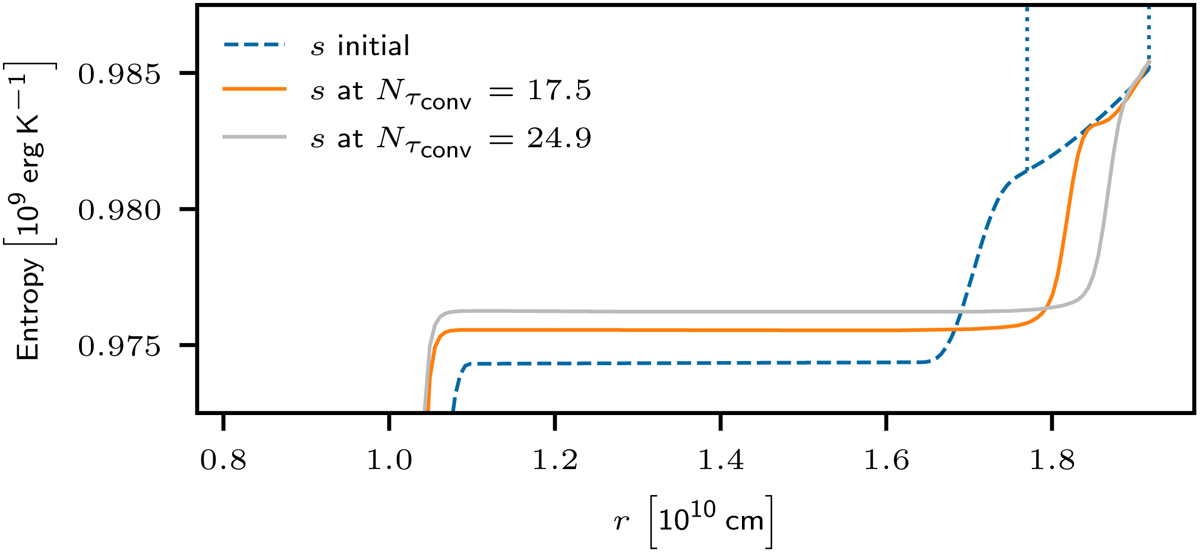
Fig. 19.
Download original image
Initial entropy profile and profiles after 17.5 and 25 convective turnover times for the 3D simulation with a grid of 180 × 902 cells, the AUSM+-up solver, and an energy boosting of b = 3 × 10⁴. Vertical dotted lines mark the region that is considered to calculate the mean entropy gradient in the radiation zone ΔsRZ/Δr from the initial entropy profile.
Current usage metrics show cumulative count of Article Views (full-text article views including HTML views, PDF and ePub downloads, according to the available data) and Abstracts Views on Vision4Press platform.
Data correspond to usage on the plateform after 2015. The current usage metrics is available 48-96 hours after online publication and is updated daily on week days.
Initial download of the metrics may take a while.