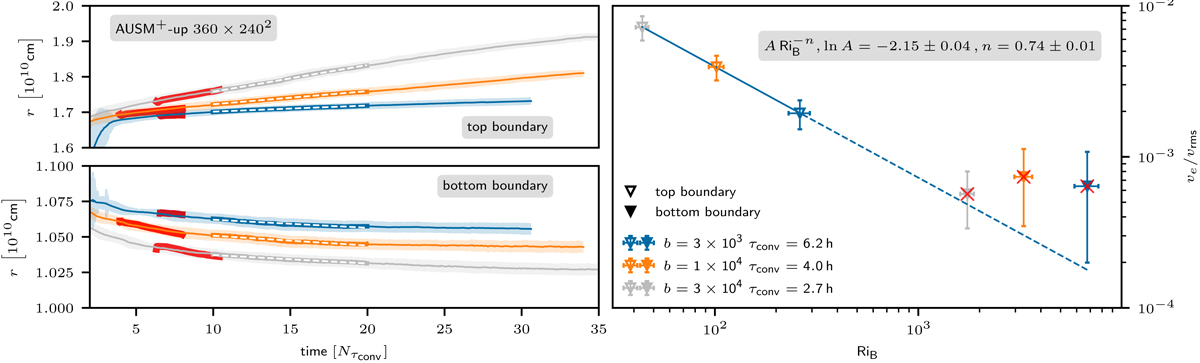
Fig. 16.
Download original image
Left plots: radial positions of the top and bottom boundaries as functions of multiples of the respective convective turnover times. The radial position is the average position over all angles, the shading marks the corresponding spatial standard deviation of the boundary position. The white dashed lines indicate the time frame considered to obtain the data for the right column. Thick red lines show the evolution of simulations with a grid size of 360 × 2402 cells for comparison. The scales of the y-axis for the top and bottom boundary have been adapted for better visibility. All simulations apply the AUSM+-up scheme while the nuclear energy release is boosted by factors of 3 × 10³, 1 × 10⁴, and 3 × 10⁴. Right plot: ratio of entrainment velocity ve and rms velocity vrms as a function of the bulk Richardson number RiB for the simulations shown in the left column. The horizontal error bars indicate the standard deviations of the temporal means of RiB. Vertical error bars correspond to the standard deviations of the entrainment velocities for a sliding window of size ΔNτconv = 1. The time frame is large enough to filter out sound waves but it is somewhat arbitrary. However, the error bars give an idea of the spread in the entrainment velocity. Markers that are crossed are not considered for fitting Eq. (17) to the data. The fit is shown as solid blue line. The dashed line at high RiB marks the regime of extrapolation.
Current usage metrics show cumulative count of Article Views (full-text article views including HTML views, PDF and ePub downloads, according to the available data) and Abstracts Views on Vision4Press platform.
Data correspond to usage on the plateform after 2015. The current usage metrics is available 48-96 hours after online publication and is updated daily on week days.
Initial download of the metrics may take a while.