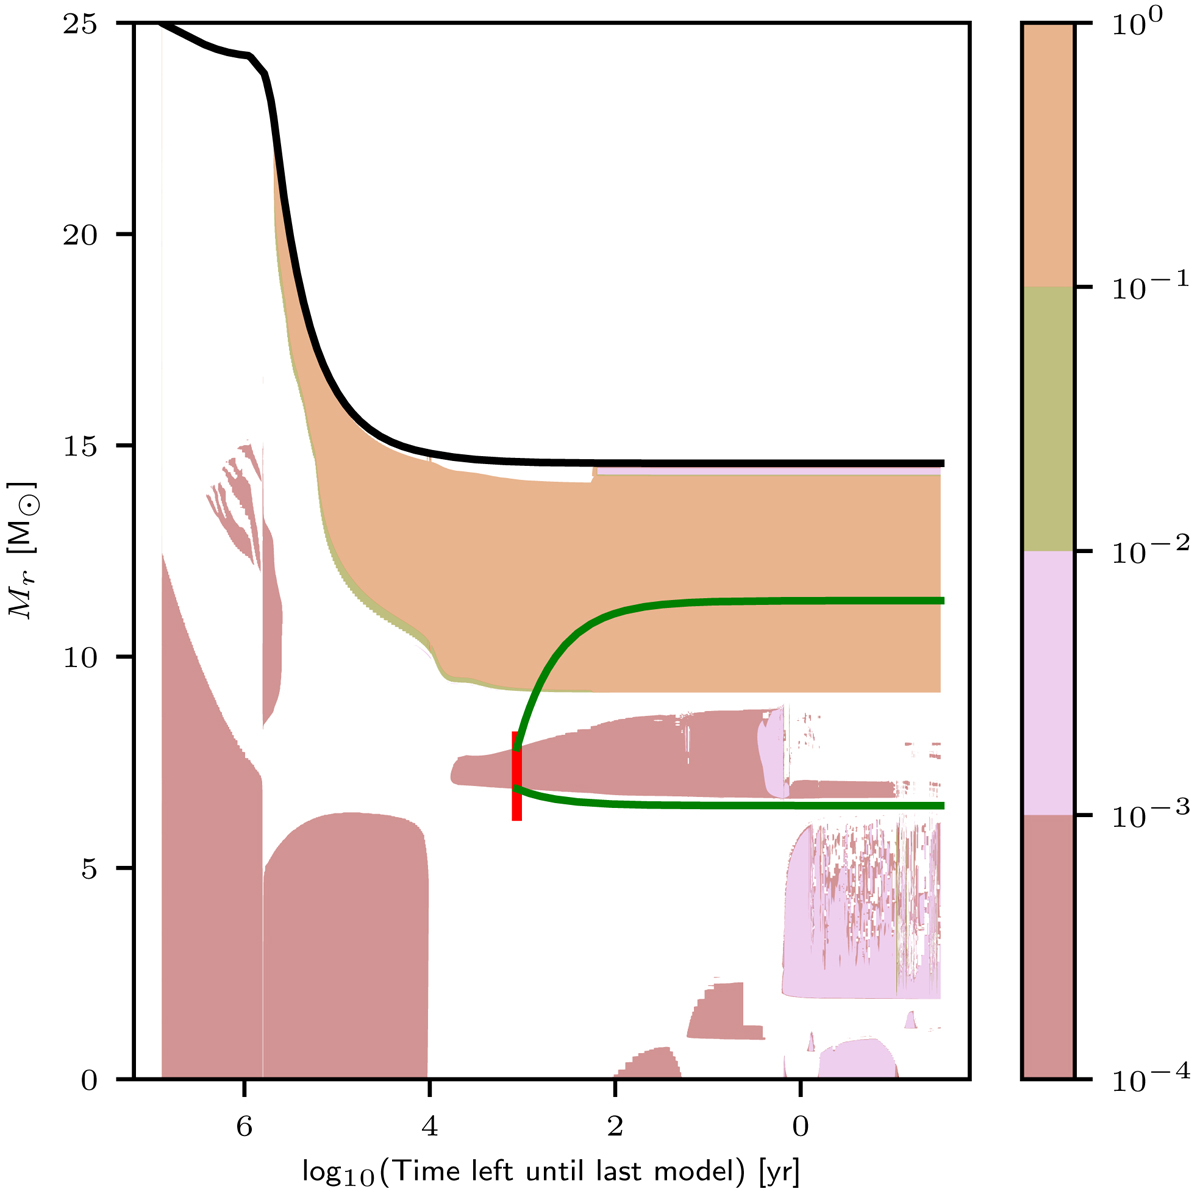
Fig. 1.
Download original image
Convective regions during the evolution of an 1D 25 M⊙ star model simulated with the MESA code. Shaded regions correspond to convection zones. The color-shading represents the mixing-length theory (MLT)-predicted Mach number. The black solid line denotes the total mass of the model. The red vertical line indicates the point in the evolution at which the SLH simulations start and the mass extent of the initial model. The green lines indicate the mass entrainment at the upper and lower boundaries as extracted from the 3D hydrodynamic simulations. See discussion in Sect. 5.4.
Current usage metrics show cumulative count of Article Views (full-text article views including HTML views, PDF and ePub downloads, according to the available data) and Abstracts Views on Vision4Press platform.
Data correspond to usage on the plateform after 2015. The current usage metrics is available 48-96 hours after online publication and is updated daily on week days.
Initial download of the metrics may take a while.