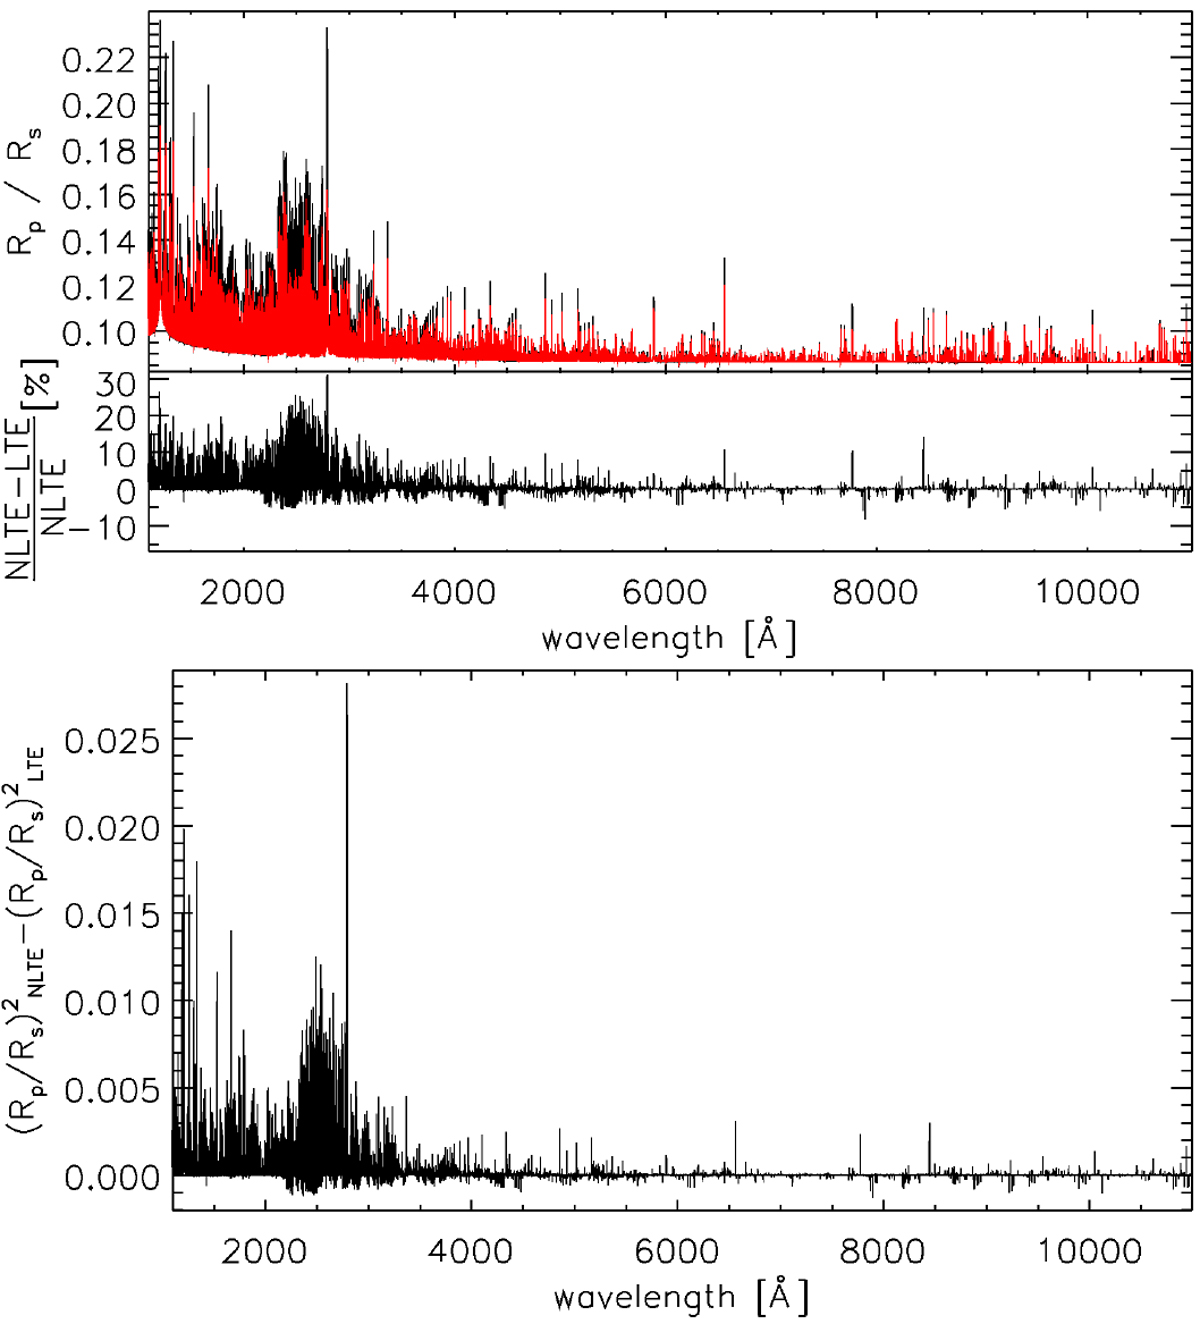
Fig. 8
Download original image
Comparison between LTE and NLTE KELT-9b transmission spectra. Top: NLTE (black) and LTE (red) transmission spectra of KELT-9b ranging between the far-ultraviolet and the near-infrared. The transmission spectra were computed considering a spectral resolution of 100 000. The NLTE transmission spectrum was computed on the basis of the NLTE TP profile, while the LTE transmission spectrum was computed on the basis of the LTE TP profile. Bottom panel: deviation from LTE (in %). The strongest deviation from LTE is found at ultraviolet wavelengths. Bottom: transit depth difference between the NLTE and LTE transmission spectra.
Current usage metrics show cumulative count of Article Views (full-text article views including HTML views, PDF and ePub downloads, according to the available data) and Abstracts Views on Vision4Press platform.
Data correspond to usage on the plateform after 2015. The current usage metrics is available 48-96 hours after online publication and is updated daily on week days.
Initial download of the metrics may take a while.