Fig. F.2
Download original image
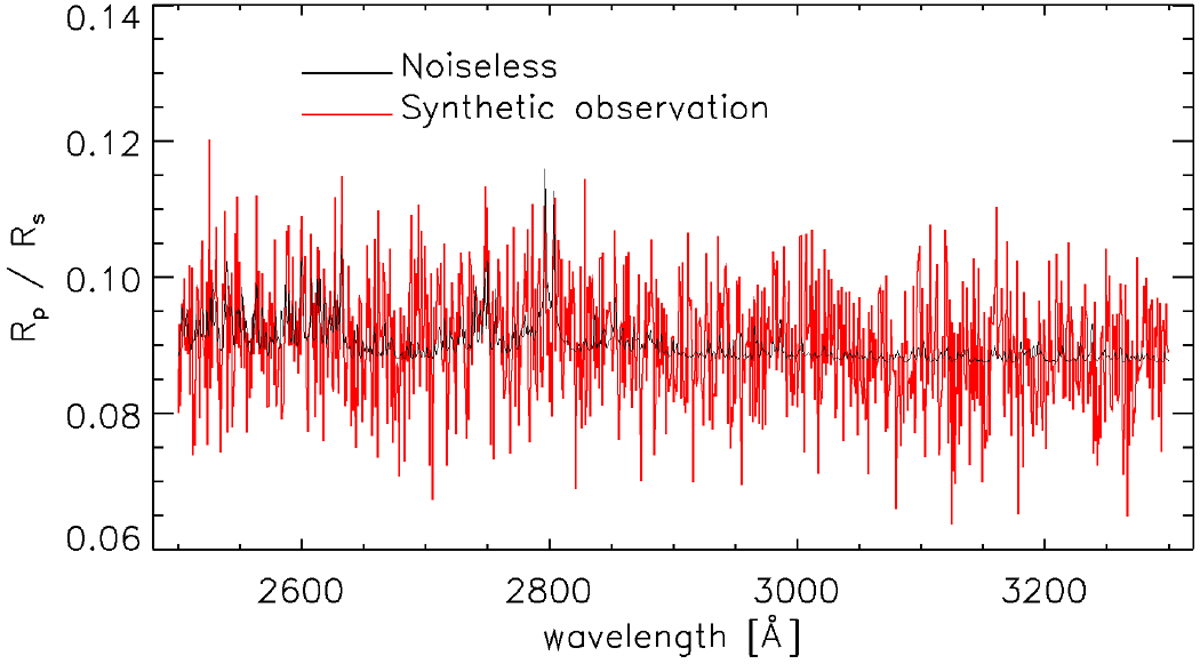
Simulated transmission spectrum (red line) obtained following ten CUTE transit observations. The transmission spectrum accounts for instrument spectral resolution and wavelength sampling, and it has been obtained binning together two pixels. The black line shows the transmission spectrum without noise and binning, but accounting for instrument spectral resolution and wavelength sampling.
Current usage metrics show cumulative count of Article Views (full-text article views including HTML views, PDF and ePub downloads, according to the available data) and Abstracts Views on Vision4Press platform.
Data correspond to usage on the plateform after 2015. The current usage metrics is available 48-96 hours after online publication and is updated daily on week days.
Initial download of the metrics may take a while.