Fig. F.1

Download original image
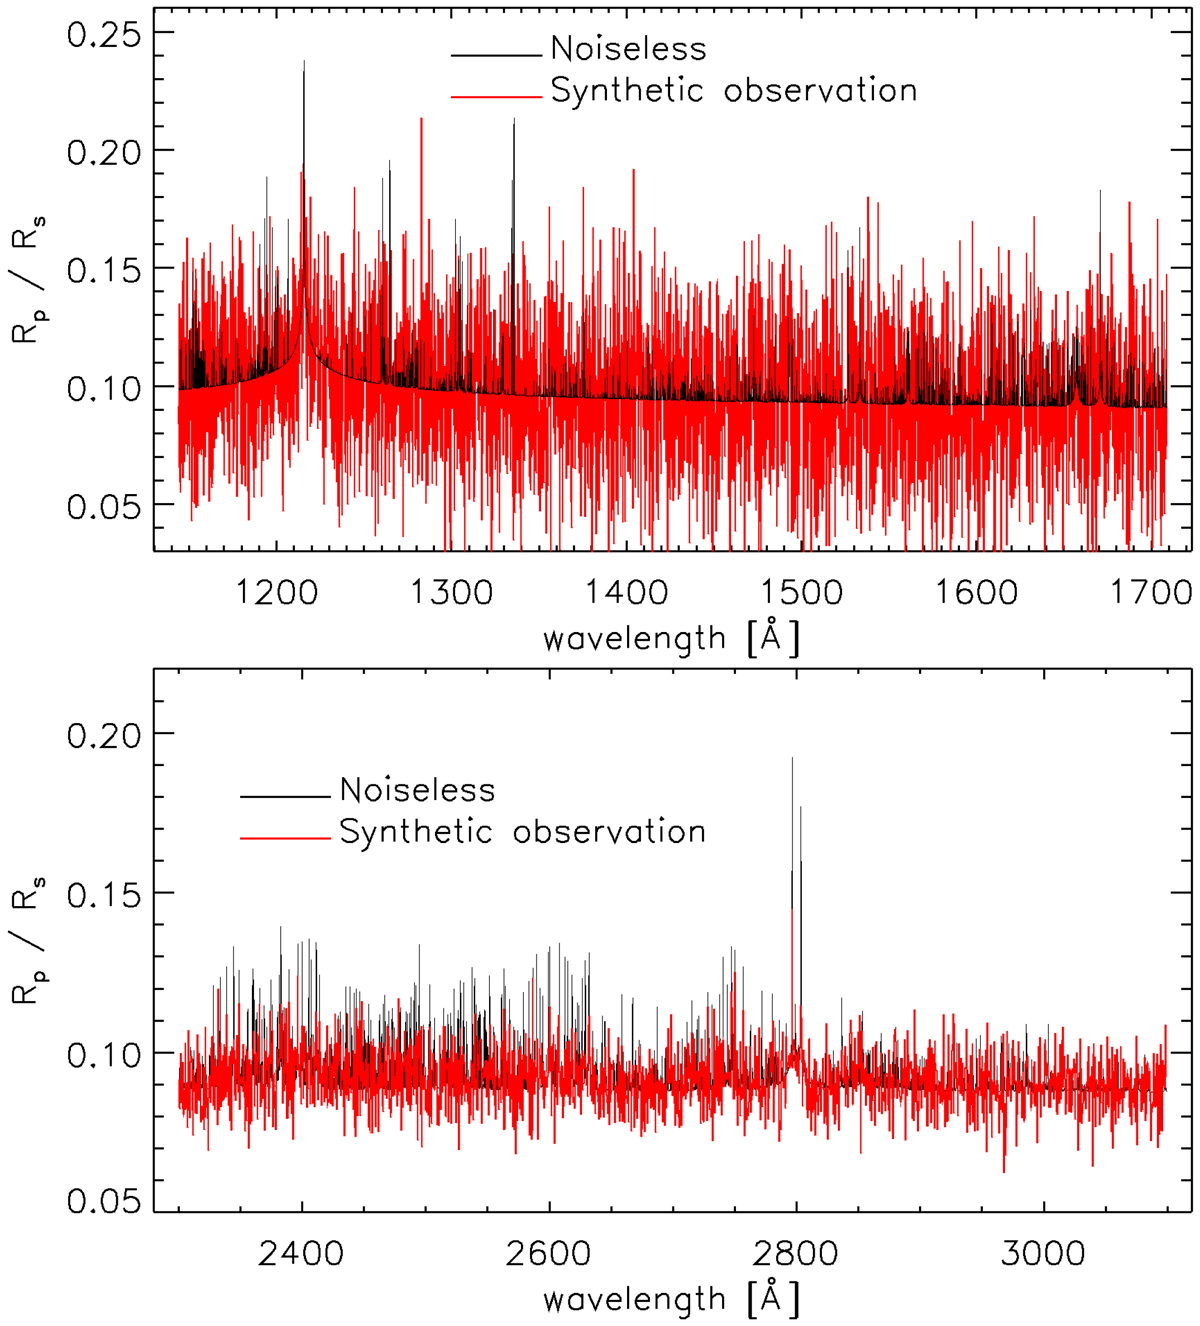
Simulated STIS ultraviolet transmission spectra. Top: simulated transmission spectrum (red line) obtained following two far-ultraviolet HST STIS transit observations collected employing the E140M grating. The transmission spectrum accounts for instrument spectral resolution and wavelength sampling, obtained by binning together ten pixels. The black line shows the transmission spectrum without noise and binning, but accounting for instrument spectral resolution and wavelength sampling. Bottom: same as top, but following two transit observations employing the E230M grating. The black line is underneath the red one for better visibility.
Current usage metrics show cumulative count of Article Views (full-text article views including HTML views, PDF and ePub downloads, according to the available data) and Abstracts Views on Vision4Press platform.
Data correspond to usage on the plateform after 2015. The current usage metrics is available 48-96 hours after online publication and is updated daily on week days.
Initial download of the metrics may take a while.


