Fig. 2
Download original image
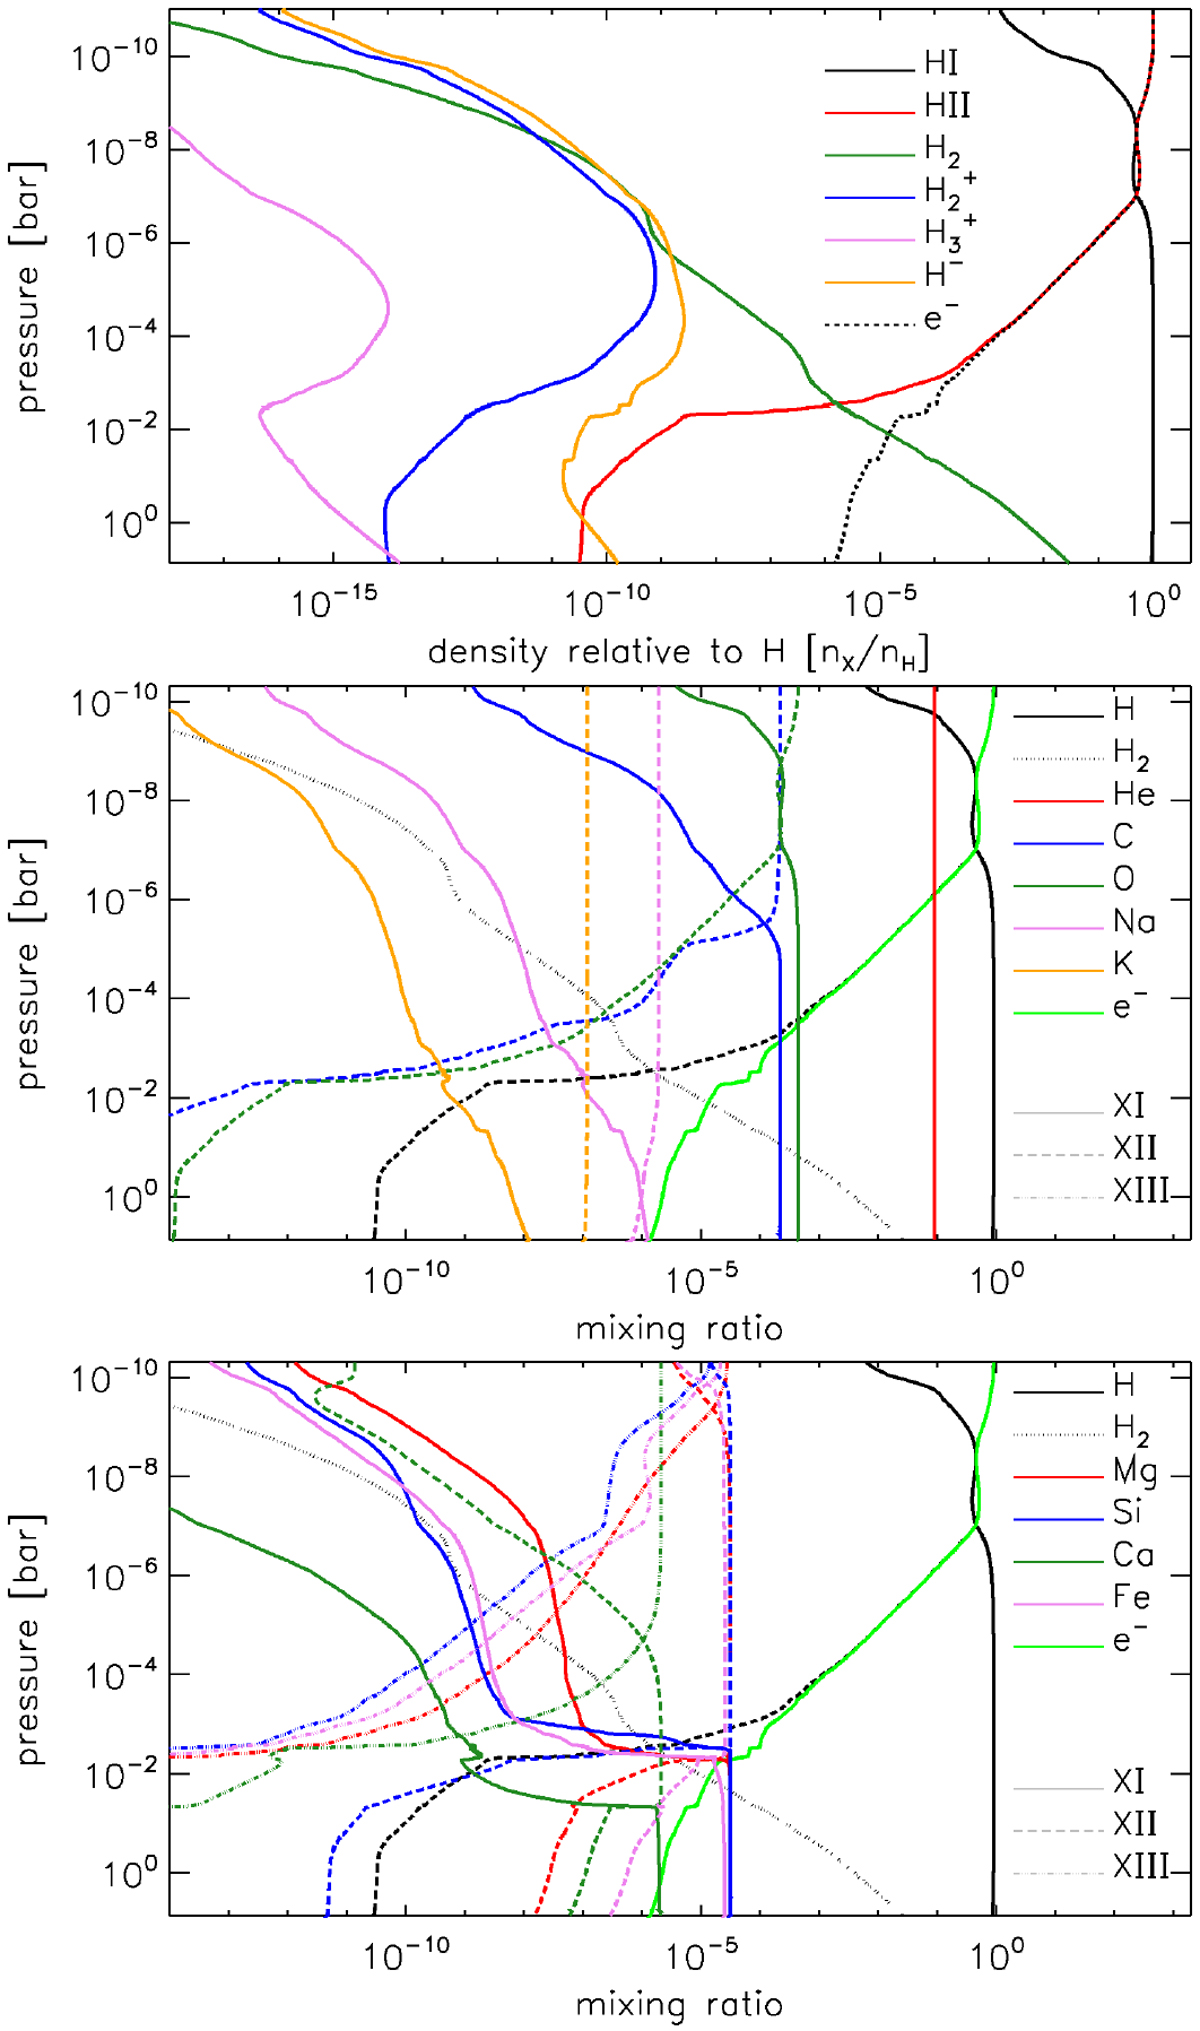
Atmospheric abundance profiles of the most important species computed by Cloudy employing the composite TP profile. Top: density relative to the total density of hydrogen for neutral hydrogen (HI; black solid), protons (HII; red), molecular hydrogen (H2; dark green), H![]() (blue), H
(blue), H![]() (violet), H− (orange), and electrons (e−; black dashed). Middle: Mixing ratios for hydrogen (black), H2 (black dotted), He (red), C (blue), O (dark green), Na (violet), K (orange), and electrons (bright green) asa function of atmospheric pressure. Neutral (XI), singly ionised (XII), and doubly ionised (XIII) species are shown as solid, dashed, and dash-dotted lines, respectively. Bottom: same as middle panel, but for Mg (red), Si (blue), Ca (dark green), and Fe (violet). The hydrogen, H2, and e− mixing ratios are shown in both middle and bottom panels for reference.
(violet), H− (orange), and electrons (e−; black dashed). Middle: Mixing ratios for hydrogen (black), H2 (black dotted), He (red), C (blue), O (dark green), Na (violet), K (orange), and electrons (bright green) asa function of atmospheric pressure. Neutral (XI), singly ionised (XII), and doubly ionised (XIII) species are shown as solid, dashed, and dash-dotted lines, respectively. Bottom: same as middle panel, but for Mg (red), Si (blue), Ca (dark green), and Fe (violet). The hydrogen, H2, and e− mixing ratios are shown in both middle and bottom panels for reference.
Current usage metrics show cumulative count of Article Views (full-text article views including HTML views, PDF and ePub downloads, according to the available data) and Abstracts Views on Vision4Press platform.
Data correspond to usage on the plateform after 2015. The current usage metrics is available 48-96 hours after online publication and is updated daily on week days.
Initial download of the metrics may take a while.