Fig. 10
Download original image
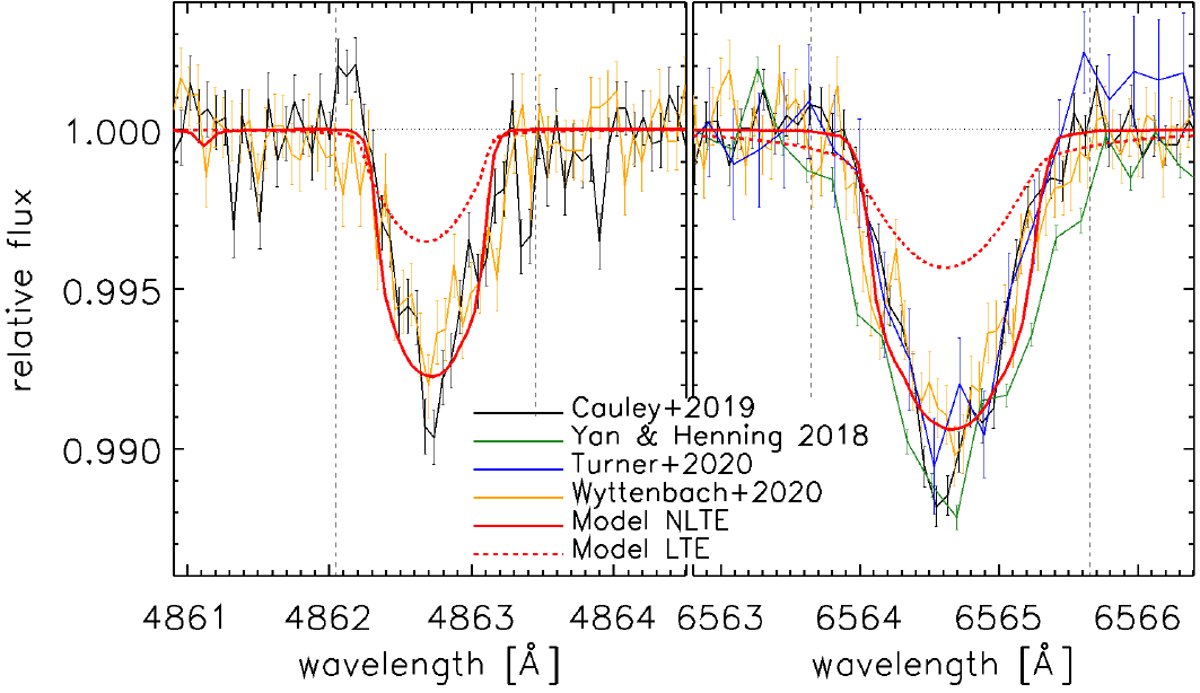
Transmission spectra of the Hα (right) and Hβ (left) lines presented by Yan & Henning (2018, green), Cauley et al. (2019, black), Turner et al. (2020, blue), and Wyttenbach et al. (2020, orange). Wavelengths are in vacuum to match those of the synthetic transmission spectrum. The data have been rebinned by a factor of six for visualisation purposes, and have been aligned to the same wavelength employing Gaussian fits (see Fossati et al. 2020). The red solid and dashed lines show the synthetic NLTE and LTE transmissionspectra, respectively. The vertical black dashed lines enclose the wavelength ranges considered to compute the χ2 and ![]() values. The horizontal dotted line at 1.0 sets the continuum level to guide the eye.
values. The horizontal dotted line at 1.0 sets the continuum level to guide the eye.
Current usage metrics show cumulative count of Article Views (full-text article views including HTML views, PDF and ePub downloads, according to the available data) and Abstracts Views on Vision4Press platform.
Data correspond to usage on the plateform after 2015. The current usage metrics is available 48-96 hours after online publication and is updated daily on week days.
Initial download of the metrics may take a while.