Fig. 1

Download original image
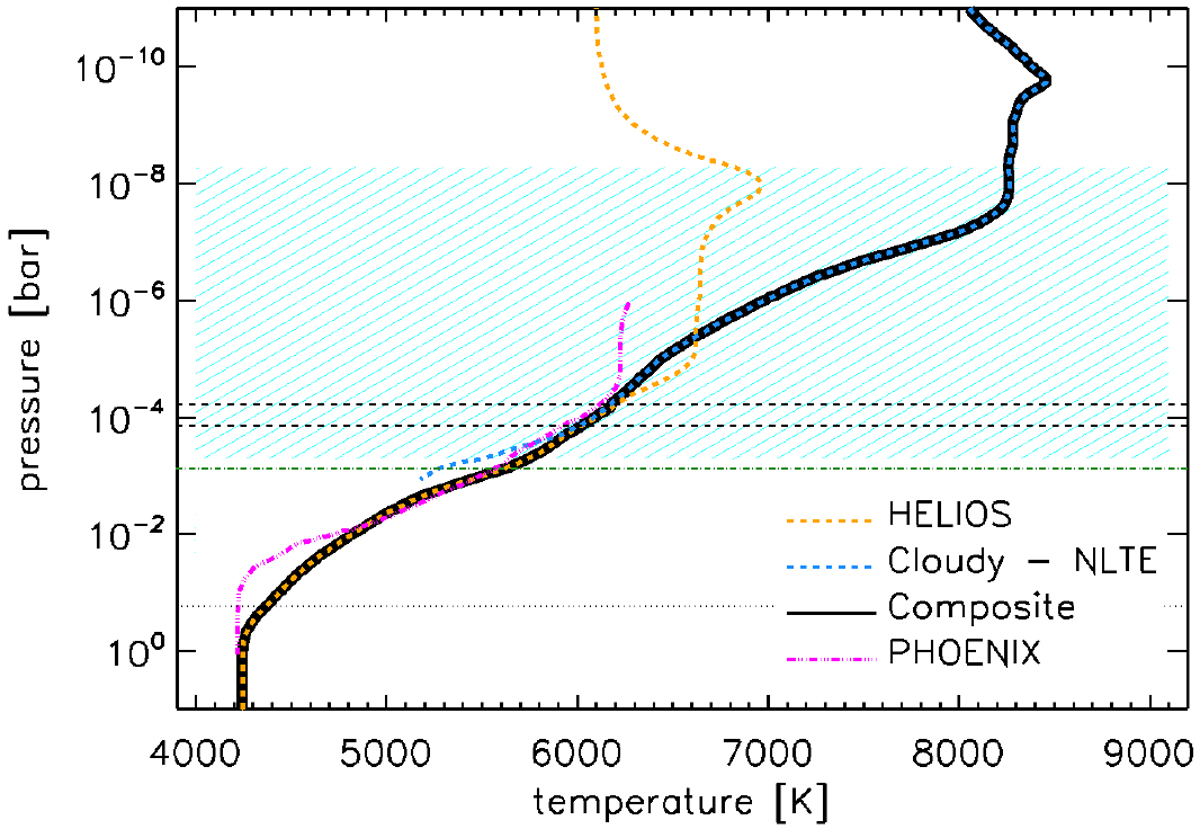
Temperature-pressure profiles obtained employing HELIOS (orange dashed line) and Cloudy (in NLTE; cyan dashed line). The black solid line shows the composite TP profile, while the horizontal black dashed lines indicate the location within which the HELIOS and Cloudy TP profiles have been merged. The horizontal dark green dash-dotted line indicates the location of Cloudy’s upper density limit (1015 cm−3). The magenta dash-dotted line shows the TP profile computed with PHOENIX (Lothringer & Barman 2020). The hatched area indicates the main line formation region (Turner et al. 2020; Fossati et al. 2020).
Current usage metrics show cumulative count of Article Views (full-text article views including HTML views, PDF and ePub downloads, according to the available data) and Abstracts Views on Vision4Press platform.
Data correspond to usage on the plateform after 2015. The current usage metrics is available 48-96 hours after online publication and is updated daily on week days.
Initial download of the metrics may take a while.


