Fig. 9.
Download original image
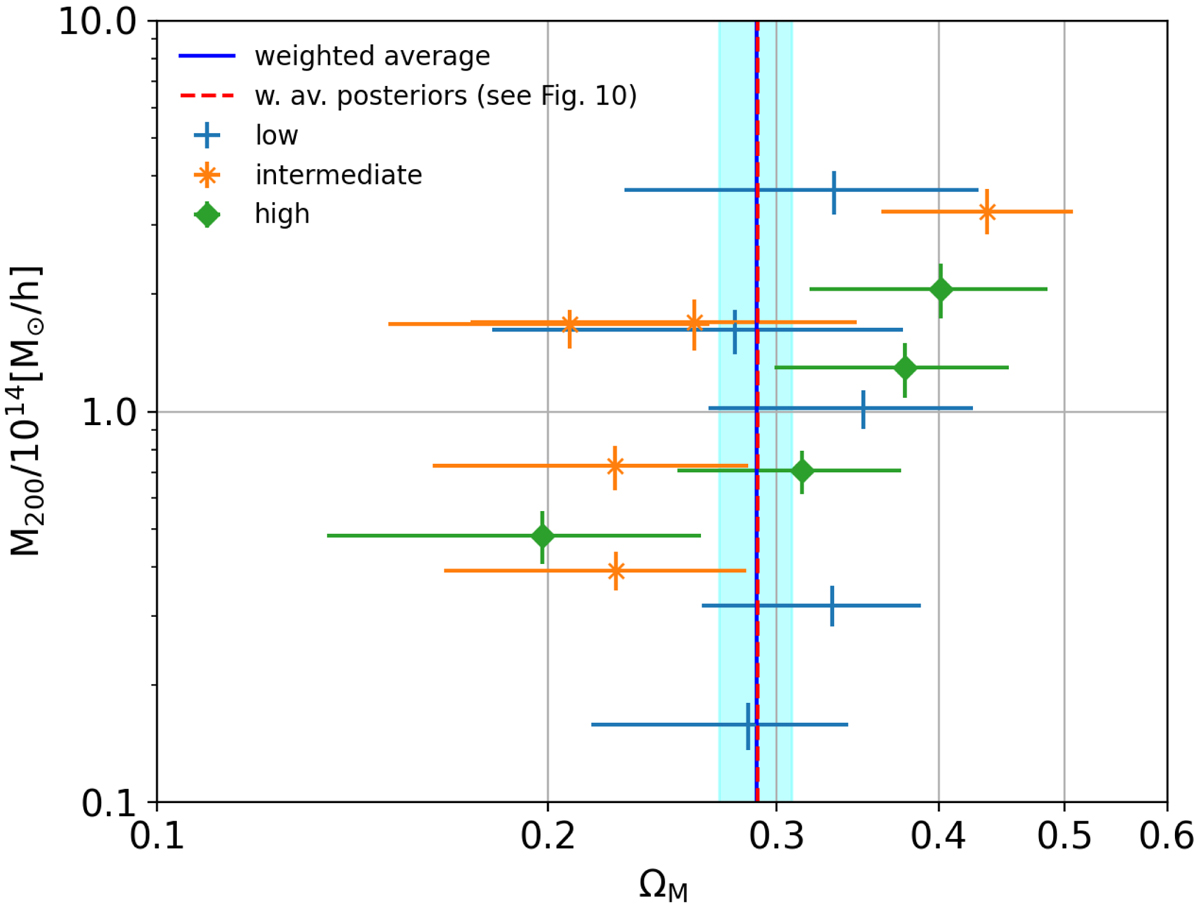
Correlation between the recovered cluster mass and total matter density parameter from our stacked weak lensing analysis. The different coloured data points refer to three redshift ranges considered (see legend, top left corner). The blue solid line displays the weighted average of the various estimated ΩM for the different amplitude and redshift bins; the cyan shaded region encloses the 1σ uncertainty. The dashed red line gives the weighted average of the posterior distributions, as in Fig. 10.
Current usage metrics show cumulative count of Article Views (full-text article views including HTML views, PDF and ePub downloads, according to the available data) and Abstracts Views on Vision4Press platform.
Data correspond to usage on the plateform after 2015. The current usage metrics is available 48-96 hours after online publication and is updated daily on week days.
Initial download of the metrics may take a while.