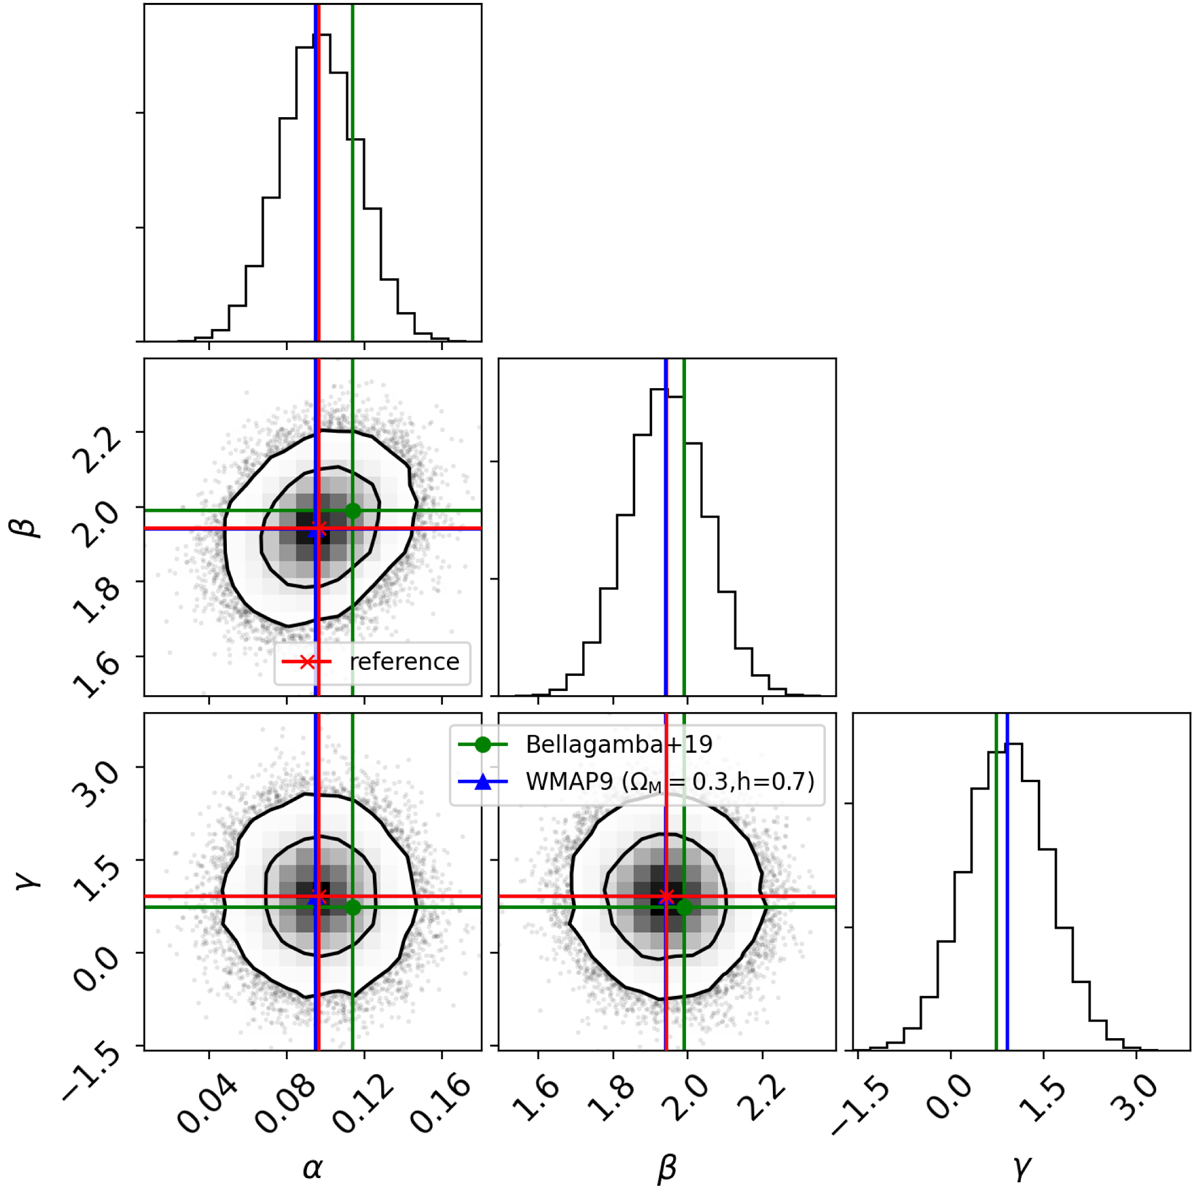
Fig. 7.
Download original image
Posterior distributions of the parameters of the mass-amplitude relation in Eq. (18). The contours show the 68th and 95th percentiles of the distributions. For comparison, also shown are the results for α, β, and γ obtained by Bellagamba et al. (2019) (green squares) and when assuming a flat WMAP9 cosmology, fixing ΩM = 0.3 and h = 0.7.
Current usage metrics show cumulative count of Article Views (full-text article views including HTML views, PDF and ePub downloads, according to the available data) and Abstracts Views on Vision4Press platform.
Data correspond to usage on the plateform after 2015. The current usage metrics is available 48-96 hours after online publication and is updated daily on week days.
Initial download of the metrics may take a while.