Fig. A.1.
Download original image
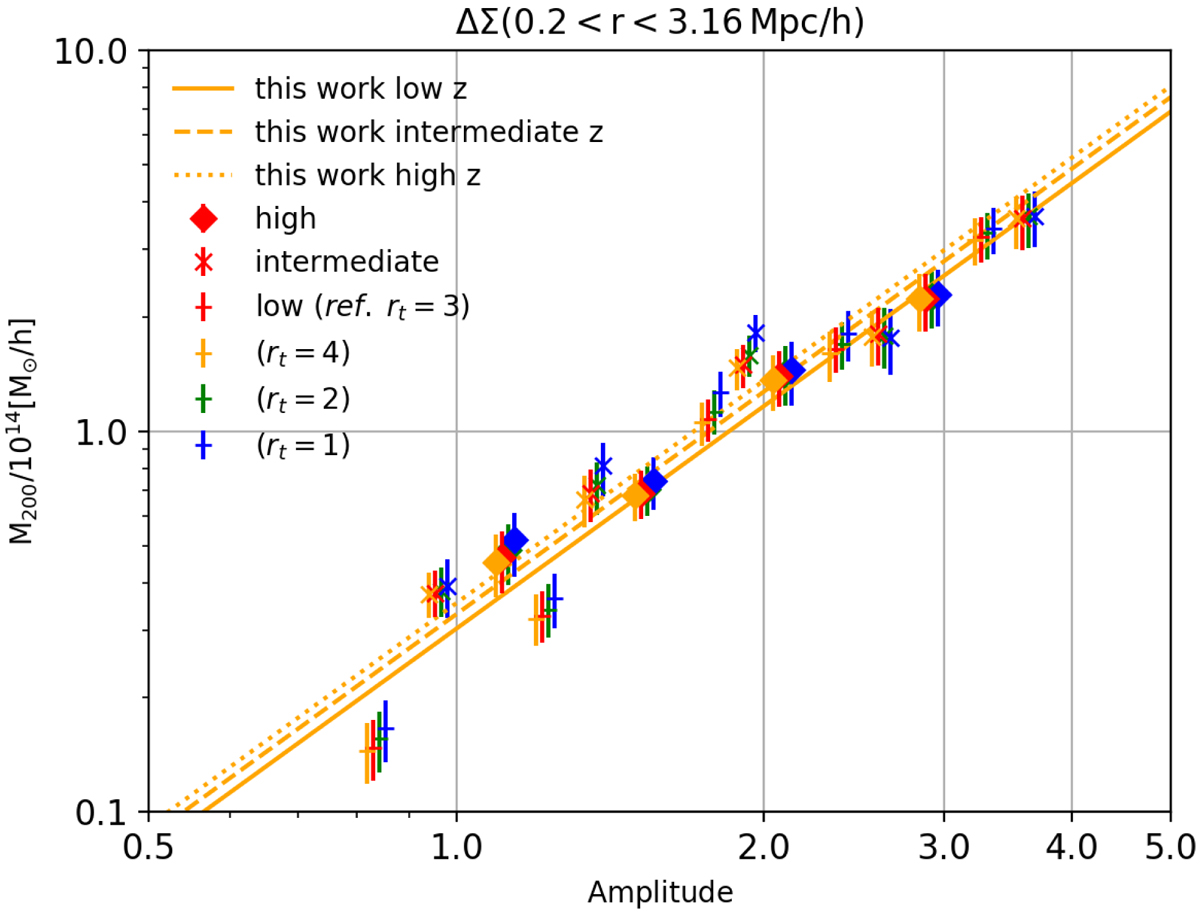
Mass-amplitude relation obtained using different modelling of the truncation radius; orange, green, and blue refer to the cases with rt = 4, rt = 2, and rt = 1, respectively. The red data points show the results for our reference model with rt = 3. We slightly displace the data points along the x-direction, computed with different truncation radius definitions, to make the results more visible. The orange lines exhibit the best-fit results for our reference case for the ∼1h case dataset, as in the first line of Table 2.
Current usage metrics show cumulative count of Article Views (full-text article views including HTML views, PDF and ePub downloads, according to the available data) and Abstracts Views on Vision4Press platform.
Data correspond to usage on the plateform after 2015. The current usage metrics is available 48-96 hours after online publication and is updated daily on week days.
Initial download of the metrics may take a while.